Growing up, my parents would listen to the radio every morning getting ready for the day. It was always on an AM news station, and when Paul Harvey came on, it was time for the kids to be quiet. For those under 30, Mr. Harvey was a great orator, and after the surprise ending to his tale of the day, he would sign off by saying “and now you know the rest of the story. Paul Harvey, Good day”.
Now, what could Paul Harvey have to do with equity valuations? Sometimes the simple question, that seems to have an obvious answer, needs a bit more color. You need to hear “the rest of the story”.
On the last trading day of 2018, the S&P 500 closed at 2,506. Today, that same S&P 500 is trading at 4,575. That is an increase of 82.5% in just 34 months! This is even more incredible when you consider that the US economy (and the world) has been dealing with a global pandemic for 20 of those 34 months. It is easy to understand why so many of our clients are asking the question “is the stock market expensive?”
This should be an easy question to answer. The most common way to value an individual stock, or stock index, is to divide stock price (P) by their earnings (E) to determine their Price to Earnings (or P/E) multiple. Let’s take a look at the past several years of both earnings and price for the S&P 500 to get some “base” expectations.
| Year | Earnings | Ending Price | P/E Ratio |
| 2016 | 117.93 | 2,238.83 | 19.0 |
| 2017 | 130.70 | 2,673.61 | 20.5 |
| 2018 | 158.30 | 2,506.85 | 15.8 |
| 2019 | 159.89 | 3,230.78 | 20.2 |
| 2020 | 137.24 | 3,756.07 | 27.4 |
| 2021 | 200.97* | 4,537.02** | 22.6 |
| 2022 | 218.75* | 20.7 |
*Expected earnings from FACTSET, **as of 10/25/21,
The 5-year average P/E ratio (2016-2020) for the S&P 500 is 20.6. The current P/E at 22.6 is higher, so the quick answer is, yes, the market is more expensive. But let’s take a deeper look. At the end of 2020, the S&P was trading with a P/E of 27.4, and despite that “expensive multiple” the S&P 500 is up more than 20% so far in 2021 with a lower multiple than we started the year with. How did that happen? The quick answer is the strength in the economy and the corresponding strength in corporate earnings.
When we are looking ahead to earnings, we use the analysts’ earnings expectations to help determine the valuation of the market. These analysts’ expectations are usually very close to the real number. Other times, not so much. As the impact of COVID was starting to be understood, corporations stopped giving guidance to the analysts that covered them. Left with no help from the companies, analysts used very conservative earnings estimates. Through the first half of 2021, earnings estimates rose dramatically as the reopening of the economy. The delta wave that we experienced during the 3rd quarter did dampen the economic recovery. Thankfully, the delta COVID numbers are decreasing, and we are optimistic that in the 4th quarter and the first half of 2022 we can see that economic momentum return. We believe that, like the first half of 2021, strong economic activity will result in better corporate earnings than is currently anticipated. All of that being said, the stock market is more expensive than a historical “normal” level.
The Rest of the Story
Here is the problem for investors. We can’t go back and buy the 2018 S&P valuations right now. There are three main asset classes for investors: stocks, bonds, and cash. (There are other options, like real estate, precious metals, and even cryptocurrency for investors to consider. For this argument, I am just going to focus on the traditional investment asset classes.) So, the question is not if stocks are expensive relative to historical equity valuations. The question is are stocks expensive relative to bonds. This is where the picture becomes much clearer for the Oakworth Investment Committee.
We have said several times this year is that stocks remain the most reasonably valued of all overvalued asset classes. Another acronym that you hear regarding stocks is TINA, or there is no alternative. The largest asset class “alternative” to stocks is fixed income. If you think stocks are expensive, just take a look at bond prices. The most common way to compare the value of stocks vs. bonds is the Fed Model. This model was used in 1997 in the Federal Reserve Humphrey-Hawking Report to congress to show the relationship between stock and bond valuations. The model was then picked up by economist Ed Yardeni. It compares the current yield on the 10-Year Treasury bond to the earnings yield on the S&P 500 (the equity earnings yield is simply earnings/price). For the S&P 500, the current earnings yield is (200.97/4,537) 4.4%, while the current yield on the 10-year US Treasury is 1.65%. Looking at the chart below, stocks are significantly UNDERVALUED relative to bonds.
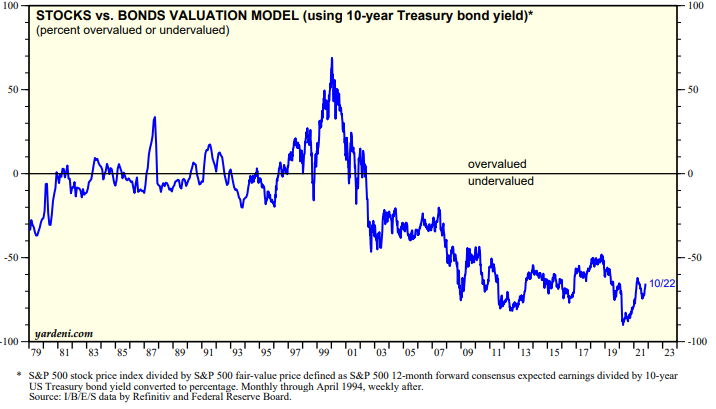
From 1980 to 1998, stock and bond valuations were much more balanced. The “Tech bubble” of 1999 made bonds look cheap relative to stocks. Strong corporate earnings, coupled with a falling interest rate environment over the past 20 years have significantly changed this picture.
Another way to think about bond valuation relative to stock valuation is to convert the yield on a 10-Year Treasury yield into a P/E ratio.
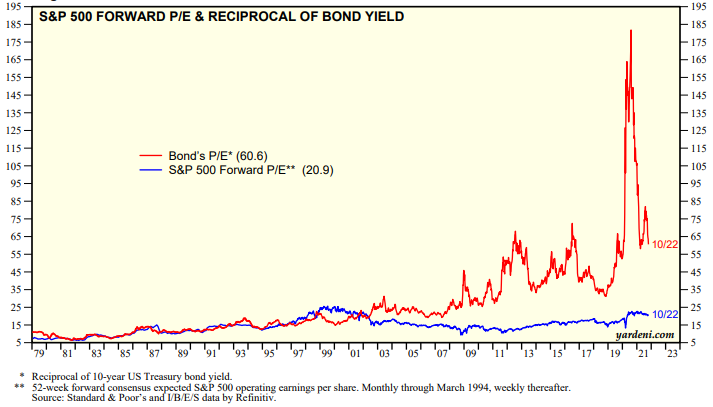
The price of the bond (100.00) divided by the earnings (or yield) of 1.65 gives the 10-Year Treasury a P/E of 60.6. Relative to that number, the current P/E on the S&P 500 of 22.6 doesn’t seem so expensive anymore.
Finally, holding some small cash position in your asset allocation for liquidity needs is necessary and appropriate. Cash, however, is currently yielding a near-zero return. With inflation starting to become an issue, holding cash is a sure way to erode your purchasing power by somewhere between 3% and 5% a year. This does not seem like a great environment to hold a significant cash position in your asset allocation.
So, the answer is yes, stocks are somewhat expensive right now. But compared to bonds and cash, the stock market is the most reasonably valued of all overvalued asset classes.
And now you know the rest of the story.
David McGrath, Good Day!