
Economic doom and gloom has been a consistent theme in the media lately, both from economists as well as newsroom “experts.” But if the economy is as bad as they say, why doesn’t it look like 2008 all over again? Where is the 21st century version of Black Monday from the late 1980s?
As our John Norris, Chief Economist, might say: “These are confusing times.”
Due to an unprecedented global pandemic that shut down most of the world, legislators raced to cut interest rates (quantitative easing), created new lending programs (CARES Act), and pumped the monetary system full of cash in the forms of the Paycheck Protection Program and “stimulus” checks that were directly deposited into Americans’ bank accounts. The lattermost action has likely been the most impactful of all.
In the short term, this “fix” prevented economic disaster while businesses were closed. In the long term, it caused a ballooning M2 money supply – something not even the most astute economists could pick up on at the time. It’s like tossing gas onto smoldering coals in an attempt to create a small flame. Everything blows up all at once. Sure, it may not be fun to sit in the cold, but it’s also not very fun to burn the whole tent down, especially if the replacement tent is on backorder for six months. By the time U.S. households began to feel the burn, it was already too late. Inflation was upon us.
To combat this new, rapidly growing inflation, the Federal Reserve took to quantitative tightening (QT). They hiked up the overnight lending rate at a historically fast pace, and discontinued some of the pandemic-era lending programs to better align supply with demand. A quantitative tightening cycle typically takes some time to pass through the monetary system and take effect; however, some sectors were almost immediately impacted.
THE BANKS
In March 2023, about a year into the tightening cycle, the financial sector went into a panic as two regional banks went insolvent due to poor bond duration management. While this isn’t inherently caused by credit tightening (just exacerbated by it), it caused a chain reaction of bank runs, and many consumers lost confidence in the banking industry.
REAL ESTATE
As for real estate, both businesses and consumers are feeling the effects. The pandemic sent many employees to work from home, leaving countless empty offices. Consumers, on the other hand, are now facing ballooning mortgage rates (some have shot up over 4%); increasing credit card interest rates that have seen household saving rates dwindle; and a possible recession on the horizon that could see an abrupt change to the historic unemployment rate we have recently enjoyed.
U.S. SAVINGS RATE
During the pandemic, the U.S. personal savings rate (i.e., the rate at which consumers save their income) hit a peak of 33.8% – the highest rate we have ever seen in history, as global shutdown makes it hard to spend money. This was nearly double the United States’ next highest rate of 17.3% in 1975. The result? Households were flush with cash and only had one thing on the mind: SPEND!! And spend they did, as economic downturn fears turned to a red-hot economy that could not produce fast enough for ravenous consumers. American consumers were seeing shortages on a whole slew of items, from toilet paper to brand new (higher than sticker price) cars.
PERSONAL SAVINGS RATE

Source: Bloomberg Financial
After three rounds of stimulus checks, the U.S. consumer got a little too familiar with free money spending. Consumers then turned to revolving credit (i.e., credit cards) in order to keep the party going.
CONSUMER DEBT
During the pandemic, many Americans paid down existing debt with this extra spending money that came from the government.
- From March 2020 to April 2021, the U.S. credit card debt and other revolving loans fell from a high of $858 billion to $736 billion, representing a 14% decrease. This was a win for many Americans, but there’s a saying about if something is too good to be true.
- Around this same time inflation began to rear its ugly head. Americans began spending more and more on everyday goods and services at an alarmingly increasing pace. Revolving debt crept up again, ballooning from the $736 billion number in April 2021 to $994 billion in June 2023, with no sign of slowing down.
- The above-mentioned household savings rate decreased from 33.8% to a much reduced 4.6% in January 2023. In both of these instances, we appear to be in worse shape post-pandemic than pre-pandemic.
- Adding to this: the average credit card interest rate is 24.06% as of July 2023. You can begin to understand the pain that Americans’ wallets are feeling.
This presents the question, did the government go too far with its pandemic relief programs? Was this just short-sighted panic that we will suffer from later? Or were these programs necessary to keep things above water during an unprecedented time?
CREDIT CARDS AND OTHER REVOLVING DEBT

Source: Bloomberg Financial
The pre-pandemic U.S. consumer had the benefit of a historically low cost to borrow money, leading to an already-competitive market for buyers. The FHFA (Federal Housing Finance Agency) House Price Index measured around $280,000 for an average home. As of mid-2022 (and post rate increase), average prices were at $395,000.
Why the change? Likely interest rates, coupled with pandemic lending programs and other government funded initiatives designed to reduce the burden of COVID on America. Interest rates have more than doubled from a 3.25% prime rate in 2020 to 8.25% currently in 2023.
What does this mean to the consumer in this post-pandemic landscape? This means that a $200,000 house financed in 2020 would have a total cost of $313,451 over the course of amortization, or a monthly payment of $1,068. The same house financed in 2023 would cost $541,556 over the course of the loan, or monthly payments of $1,700. The annual difference? $7,584.
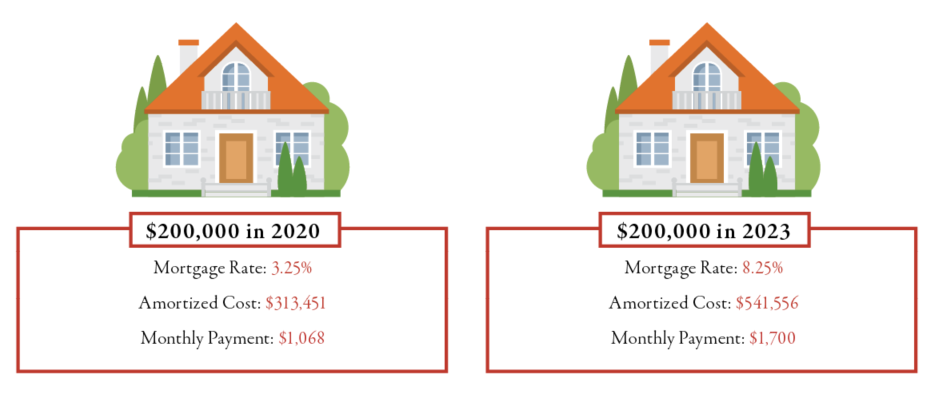
Bottomline: Many Americans were priced out of their “dream home.” For all of those who scroll on Zillow as their pass time, it might not be nearly as fun anymore!
FHFA HOUSING PRICE INDEX IN THE US

But wait! Not all things are full of doom and gloom.
While there are certainly some similarities to previous cycles, there are some pretty positive differences as well.
FIXED MORTGAGE RATES
The last time the Federal Reserve had to enact quantitative tightening was in 2006 and 2007 as the Great Recession was just getting started. The Fed was slowly reigning in demand, especially in real estate, as prices soared in a similar fashion to current day. Monthly payments as much as doubled over the tightening cycle, causing many Americans to default on their adjustable-rate mortgages. This is much unlike our current situation. Pre-pandemic, many Americans locked in fixed rates below 4%. Rather than move, they chose to hunker down and hang onto their extremely low fixed rate mortgages. Moving would force a far more expensive payment.
This, along with the increase in short-term vacation rentals, has created a shortage of homes in the U.S., keeping prices higher even in the current economic environment. According to Fannie Mae, the U.S. is around 3.8 million housing units short when taking the formation of new households into account, with even larger numbers coming from other sources. Silver lining? It is unlikely that we see widespread home foreclosures like we did in the late 2000s.
THE LABOR FORCE
The labor force is another strong point in our current economy. During the Great Recession, it was extremely hard to find companies that were hiring, especially in the finance industry. Shortly after the Great Recession had begun, the unemployment rate shot up to a peak of 10% in October of 2009 from a low of 4.4% in early 2007. While we did see this initial surge in unemployment when businesses closed at the beginning of the pandemic, we quickly saw that rate shift downward. In April of 2020, when the pandemic was in full swing, unemployment briefly touched 14.7%, much higher than the peak of 2009. Despite this, just two years later in 2022, the unemployment rate was hovering around 3.6% – a rate unseen since 1969. This quick rebound in the labor force revealed a resilient market that eased the strain businesses were feeling. More consumers with more jobs mean more spending and more corporate earnings. Averting near economic disaster, this lends ammunition against doomsayers worried about another 2008.
Now the Fed has yet another dilemma; the unemployment rate might have swung too far in the wrong direction, as low unemployment has seemed to keep inflation entrenched in the economy.
After all… who said you can’t have too much of a good thing?
CURRENT UNEMPLOYMENT RATE

For the impact on businesses, see our Corporate Response to the Current Economic Landscape, HERE.
For more from our Investment Committee in our 2nd Quarter 2023 Macro & Market Perspectives, click the image below.
The opinions expressed within this report are those of the Investment Committee as of the date published. They are subject to change without notice, and do not necessarily reflect the views of Oakworth Capital Bank, its directors, shareholders or employees.