
Lately, headlines have been dominated by debates over fiscal and monetary policy, with speculation swirling about a potential economic slowdown and how the Federal Reserve might respond. Interest rates, inflation, and government spending seem to be at the center of every financial discussion. But beyond the buzzwords, what do these shifts actually mean for the broader economy? A great starting point is to look at the yield curve, an important benchmark that reveals insights about the state of the economy.
U.S. TREASURY YIELD CURVE: 3-MONTH VS. 10-YEAR (2020-2025)
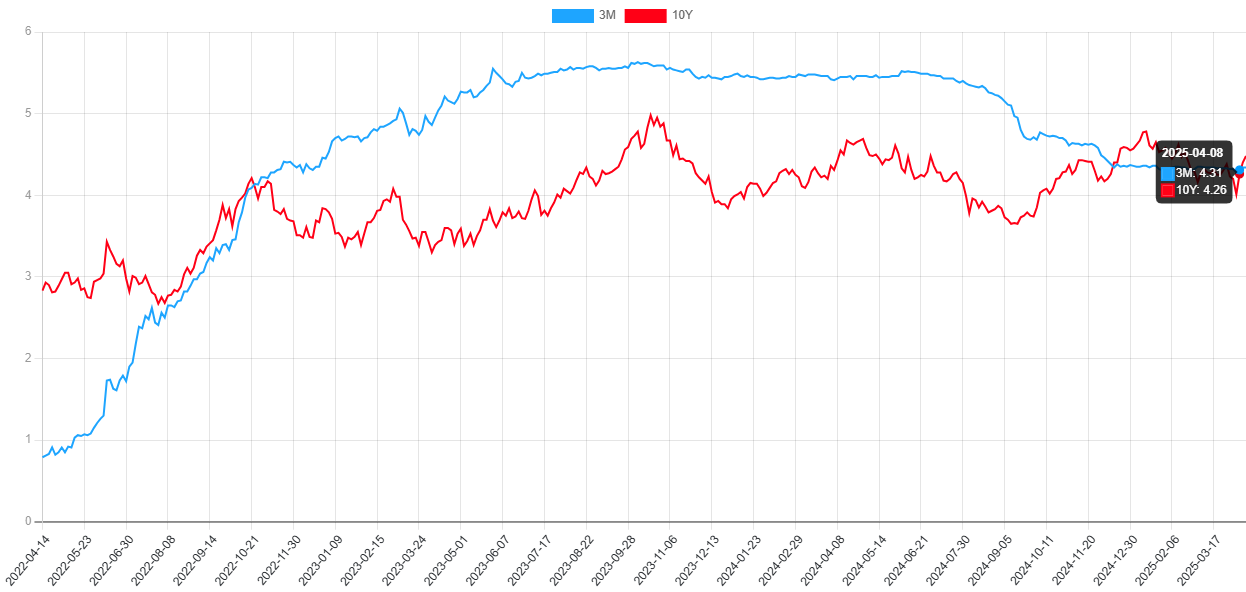
A yield curve, more specifically the U.S. treasury yield curve, is a line graph that shows the current yield of treasury instruments at different points in time. Investors can gather a multitude of different information from this chart, as it serves as an important benchmark for other debt in capital markets.
Some examples of this would be mortgage rates, corporate bonds, and other key lending rates tied to the cost of borrowing money.
Shorter-term rates on the yield curve are more directly influenced by Fed policy. When the Fed moves rates, treasuries with a duration of two years or less generally have a much higher correlation with those changes. While there are other factors at play here, this generalization can help investors rationalize changes in the yield curve. Unfortunately, this straightforward explanation does not work for the longer end of the yield curve.
Longer-term rates on the yield curve are influenced by many different factors that drive movements in price and yield. This is important for investors, as it provides insight into market expectations for the economy over the long term. While these longer-term yields can still be affected by Fed rate changes, some of the most significant influences include inflation expectations, economic growth outlook, future interest rate expectations, Fed quantitative easing/tightening cycles, demand for treasuries, and broader geopolitical circumstances. It’s a lot go digest!
When investors anticipate higher future inflation, they seek higher returns to compensate for the reduced purchasing power of their money over time.
- Treasury investors will then sell their holdings and seek other assets with greater risk premium to satisfy their
- This will lead to yields rising as bond prices
This can also happen inversely. If inflation expectations are lower in the future, investors will flock to bonds as a way to lock in steady returns, causing prices to rise and yields to fall. Economic outlook can also play an important role, when investors weigh the opportunity cost of owning a fixed income instrument during an economic boom, they are sacrificing returns from other asset classes (i.e., equity holdings). Alternatively, if the economy’s outlook is weak, investors will buy treasuries as a safe haven asset, causing yields to fall.
Last, and probably the most pertinent to our current backdrop, are the Fed’s quantitative easing and tightening cycles.
Quantitative easing is the process of the Fed using their monetary tools to increase the overall size of their balance sheet, usually in an effort to reduce interest rates and stimulate economic growth.
Quantitative tightening, by contract, is the process by which the Federal Reserve aims to decrease the size of its balance sheet — often to reduce excess liquidity and combat inflation.
The Fed can implement quantitative tightening in a few ways, but the two most common methods are:
- Selling government treasuries
- Allowing existing holdings to mature without reinvesting in new bonds
Historically, there are many examples of when the Fed has used either quantitative easing or quantitative tightening to achieve their dual mandate – price stability and maximum employment.
That raises the question—how will this impact us in the current environment?
THE MONEY SUPPLY:
During and after the COVID pandemic, the money supply increased rapidly with government spending and subsidy programs, which caused inflationary pressure. This is most evident in the M2 money supply gauge, the Fed’s estimate of the total money supply, which increased somewhere around 25% in 2020 alone.
From the start of the pandemic to the end of the national emergency in April 2023, total M2 grew by a whopping 36%. That was an unprecedented amount of money entering the system, and with it came raging inflation.
INFLATION:
Inflation, a lagging indicator, peaked at 6.8% in 2022. Before prices got out of control, the Fed jumped into action. They raised the overnight lending rate at a breakneck pace to fight inflation. This pushed yields higher across the board, with more pronounced movements on the short end of the yield curve. In May 2022 the Fed began shrinking its balance sheet by $30 billion per month, increasing to $60 billion after the first three months.
This had a significant impact on the yield curve, flooding the market with long-term treasuries and driving yields higher. The yield curve inverted, signaling investor’s worry over long-term economic conditions. Combined with other Federal Reserve monetary policies, this helped to cool inflation and drive-up key interest rates.
THE EVOLUTION OF THE YIELD CURVE: 2020-2025
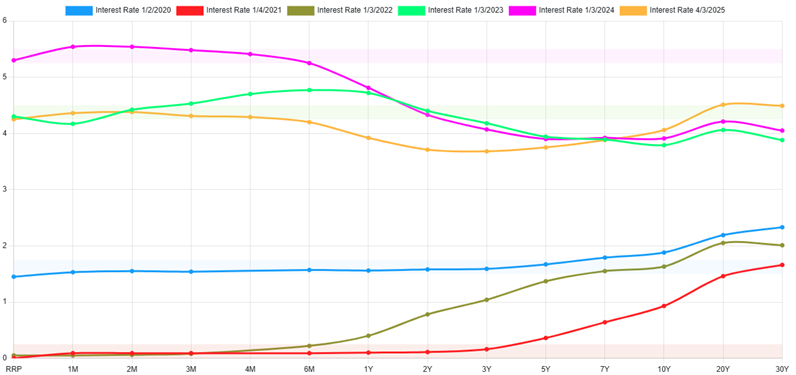
Combined with other Federal Reserve monetary policies, this helped to cool inflation and drive up key interest rates.
A TURNING POINT?
This brings us to today, as the Fed begins shifting its approach. The most recent PCE reading of 2.5% is not quite at the Fed’s 2% target, but it is moving in the right direction.
At the same time, economic data is softening, with a slight uptick in unemployment and overall economic activity slowing down. In response, the Fed began its rate-cutting cycle in the second half of 2024, bringing down short-term yields. However, as noted, this has less effect on the long end of the curve. During this period, the yield curve beg an to un-invert: 3-month yields dropped sharply while the 10-year held steady.
Additionally, the Fed announced it would slow the pace of quantitative tightening, reducing the balance sheet runoff to $5 billion per month starting April 1, 2025. Meanwhile, the government was making payments from the Treasury General Account (TGA) to major banks—part
of regular government outflows during the debt ceiling standoff—which added liquidity to markets and kept a lid on 10-year yields. But with tax revenues coming in and a new debt resolution likely, money will soon flow back into the TGA, adding upward pressure to longer-term rates.
LOOKING AHEAD
What does this mean going forward? Well, it’s likely that these pressures keep rates higher for longer across the board, but this could be especially true for the 10-year yield. Geopolitical influences have already resulted in increased volatility as investors flock to treasuries in this time of uncertainty, but sentiment about the long-term economic outlook is showing that the market expects this time of turmoil to be short lived. With so many key rates based on the 10-year yield, we can expect the cost of borrowing money to continue to be elevated. Higher rates impact consumers through more expensive mortgages and businesses by increasing financing costs. However, it’s worth noting that despite these pressures, the 10-year yield remains below its historical average. Before the 2008 financial crisis, it hadn’t been this low since the 1960s.
THE BOTTOM LINE
The yield curve remains a powerful tool for understanding market sentiment, predicting economic shifts and evaluating the cost of capital. While short-term rates are more directly influenced by the Fed, longer-term yields reflect a broader web of expectations, from inflation and growth to global uncertainty and fiscal policy. As monetary policy continues to evolve and the economy adapts, keeping an eye on the shape and movement of the yield curve can help investors, businesses, and consumers alike make more informed financial decisions. In short, the yield curve doesn’t just reflect where we are—it offers valuable clues about where we’re headed.
This content is part of our quarterly outlook and overview. For more of our view on this quarter’s economic overview, inflation, bonds, equities and allocations, read the latest issue of Macro & Market Perspectives.
The opinions expressed within this report are those of the Investment Committee as of the date published. They are subject to change without notice, and do not necessarily reflect the views of Oakworth Capital Bank, its directors, shareholders or associates.