FIRST: REVIEWING THE PATH TO 2024
Toward the end of 2023, I participated in a podcast with a nationally recognized economist about the prospects for the upcoming year. His forecast for the first half of 2024 was decidedly pessimistic, as he expected U.S. Gross Domestic Product (GDP) to shrink around 2.0%. By comparison, I was practically Pollyannaish with my outlook, at roughly 1.5% growth during the first two quarters.
At the time, he enjoyed much greater company than I did, and for good reason.
- The yield curve had been inverted since the middle of 2022, an indicator that almost always portends slower economic
- Sentiment gauges suggested the S. consumer was exhausted, while the NFIB Small Business Optimism Index implied corporate America was anything but optimistic.
- When we recorded the podcast, the Conference Board’s S. Leading Index, historically a pretty good predictor of economic activity, had been negative for 21 consecutive months.
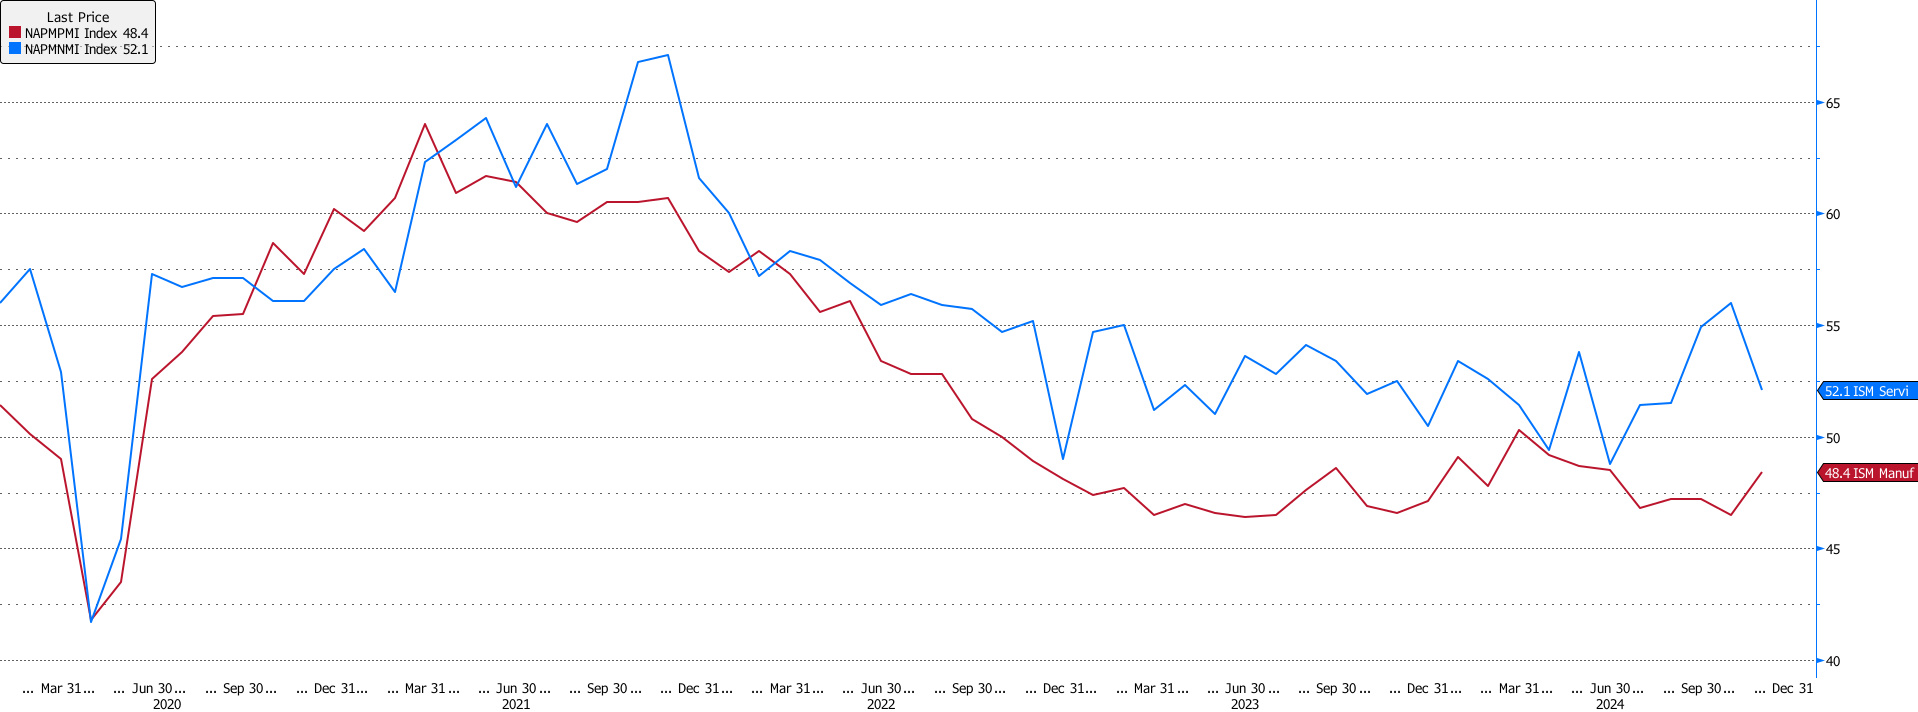
- For their part, the ISM Manufacturing PMI was telling us that domestic manufacturing had entered a recession, and the Services PMI was well below the historical
- The money supply in the S. financial system had shrunk almost $1 trillion since hitting an all-time high in April 2022.
ISM PMI TRENDS: INSIGHT INTO ECONOMIC MOMENTUM

The chart above shows how much both ISM Reports on Business had fallen after reaching a peak at the end of 2021.
In essence, virtually every commonly used economic report was calling for a slowdown in U.S. activity. The question wasn’t whether things would cool down. It was by how much. So much so, that when I threw out my 1.5% forecast, the other fellow looked a little surprised.
When the Bureau of Economic Analysis (BEA) announced 1st quarter 2024 GDP to be 1.6%, I must have seemed like a genius. However, something strange happened after that.
Instead of being a recessionary year, 2024 was one of very solid growth. While no one in their right mind would ever argue about better-than- expected economic activity, more than a few economists and analysts were left scratching their heads.
How could they have been so wrong?
First things first, thanks in no small part to massive amounts of government largesse, the domestic economy ended 2023 on very firm footing. This is important because something as diversified and complex as the U.S. economy doesn’t just stop on a dime, and its turn radius would be measured in miles, not inches.
NEXT: STEERING THROUGH 2024
As such, regardless of all negative reports, the likelihood of U.S. GDP falling from 3.2% during the 4th quarter of 2023 to, say, -2.0% at the start of 2024 wasn’t likely. To that end, I thought the other economist’s negative forecast was almost as crazy as he found my slightly positive one.
One thing is certain: neither he nor I fully anticipated Washington’s massive deficit spending this past year. To say the government has been goosing the economy would be an understatement.
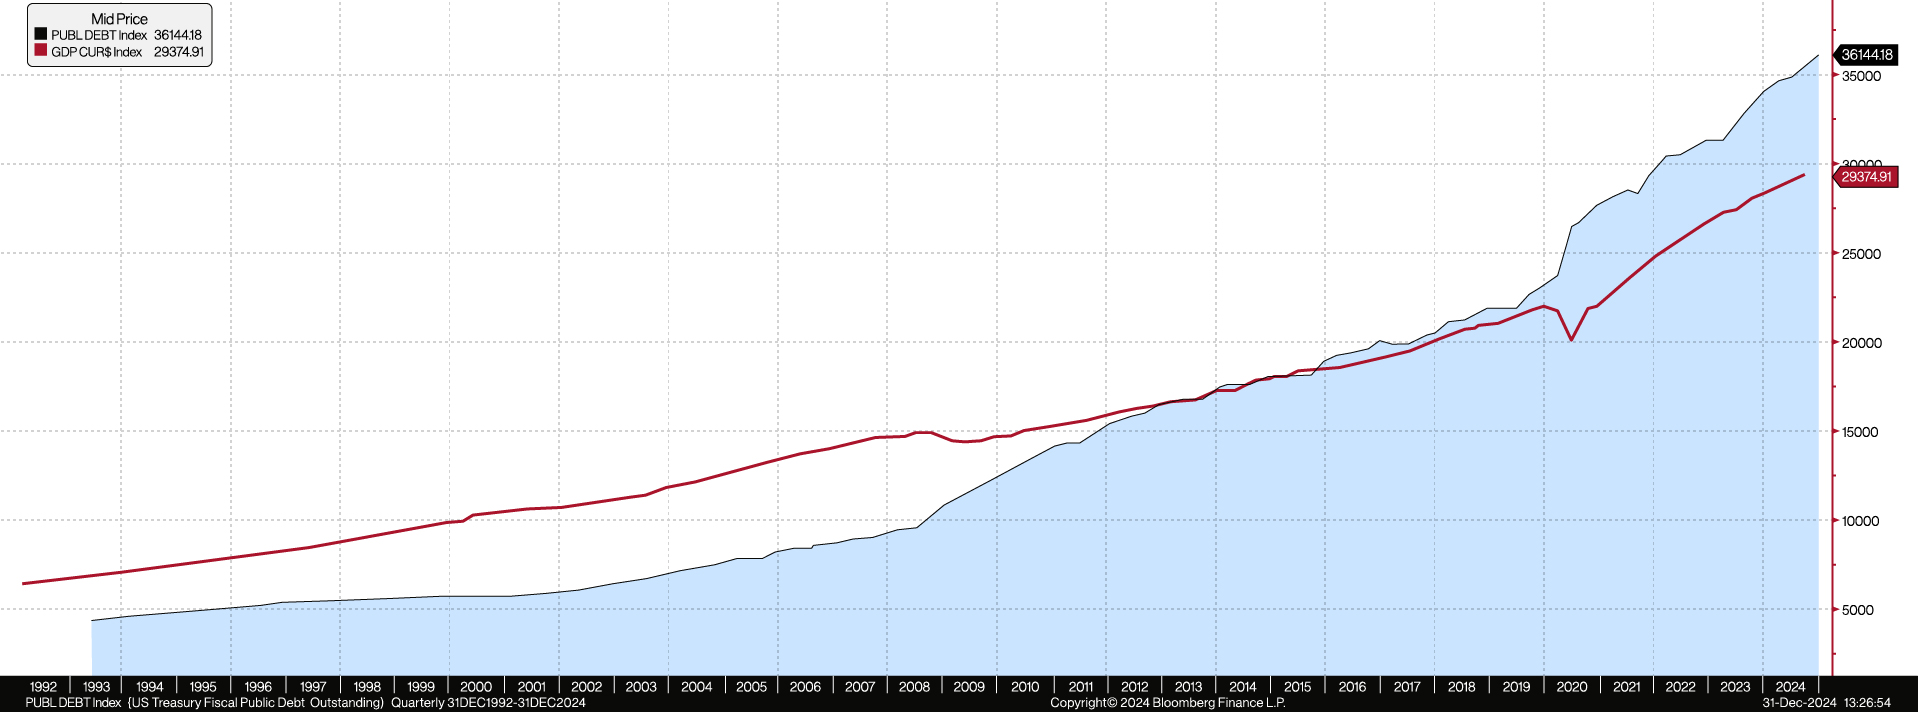
- At the end of November 2023, a week or so before we went into the studio, the S. Treasury’s total outstanding public debt was an estimated $33.879 trillion. This was up roughly $2.465 trillion over the previous 12 months.
- At the end of November 2024, it was $36.087 trillion, an increase of an additional $2.209
It is interesting to note U.S. GDP “only” increased $1.407 trillion over the 12 months ending on Sept. 30, 2024. It makes one wonder what happened to the other $800 billion, doesn’t it? To that end, if anyone thinks the government is a better allocator of capital than the private sector, how does it justify borrowing $2.209 trillion in order to generate only $1.407 trillion in economic activity?
PUBLIC DEBT GROWING FASTER THAN THE ECONOMY

However, all of that “extra” money had to go somewhere, even if it might not have been to its proverbial “highest and best use.” U.S. consumers, despite their gloom, continued to spend money freely. For their part, businesses kept buying transportation equipment, technology, inventory and, (most importantly), hiring workers.
This is incredibly important in a consumer-driven economy like ours.
- When businesses add staff, they create
- When they create paychecks, they create
- The more consumers there are, the more stuff they
- The more stuff they buy, the faster the economy
THE LABOR MARKET
Make no bones about it, the U.S. job market this past year was not as strong as it was in either 2023 or 2022. After the massive collective hiring spree in those years, it only made sense that domestic employers would slow things down in 2024. In fact, you wouldn’t have been alone if you thought U.S. businesses would actually start reducing headcount, but they didn’t.
MORE MATH
In fact, for the 12-months ending on Nov. 30, 2024, U.S. employers, including the government, added 2.274 million net, new payrolls. That is an average of 189.5K per month. Given the “median usual weekly earnings of full-time wage and salary workers” was $1,165/week for the 3rd quarter of 2024, that works out to be roughly $137.759 billion in new payroll per year (new payrolls X usual weekly earnings X 52). That is a significant amount of new money that has to go somewhere. That somewhere being: food, gas, utilities, clothing, housing, televisions, phones, etc.
In essence, what is good for job creation is good for the economy, and any new job is better than no job at all. Further, despite higher debt service costs and all the negative sentiment gauges, corporate America was able to continue its profits during the year, arguably a little more than anyone really suspected. Obviously, that helped with the hiring decisions.
But how much longer can the jobs machine continue to fuel economic growth? Perhaps more interestingly:
Something doesn’t make sense.
The answer to the second question is pretty simple. According to the Federal Reserve, wealth creation in the U.S. economy since the end of 2022 has been extremely unequal, in both absolute and relative terms.
The chart below shows just how wide the wealth gap in the United States has grown in a relatively short period of time.
THE WEALTH GAP IS WIDENING: TOP 1% VS. BOTTOM 50%

WEALTH GENERATION
At the end of 2022:
- The Bottom 50% of S. households controlled roughly $3.474 trillion in net worth, with $9.316 trillion in assets and $5.842 trillion liabilities.
- Conversely, the Top 10% had a combined net worth of $90.007 trillion, with $94.520 trillion in assets and only $4.513 trillion in
- For its part, the Top 1% controlled $40.451 trillion in total assets, and had total liabilities of $940.822
Fast forward to the 3rd quarter of 2024:
- The Bottom 50% had an aggregate net worth of $3.894 trillion, an increase of around $420.838
- By comparison, the Top 10% has seen its net worth grow $17.558 trillion, with the Top 1% making up $8.788 trillion of that
If that weren’t alarming enough, over that almost two-year time frame, the Bottom 50% has seen its liabilities increase by $188.729 billion to $6.031 trillion — this, in a rising interest rate environment. Conversely, the Top 1% has seen its debt profile actually go down by $9.864 billion to “only” $930.958 billion.
In essence, in the recent rising rate environment, the poorest among us have seen their overall level of debt increase AND their debt service soar. Obviously, this leaves them in a more precarious financial situation to meet their monthly bills even if their net worth has increased.
Put another way, the Bottom 50% has seen higher interest rates essentially gobble up much of the increase in the value of their assets. Alternatively, these rates have barely impacted the Top 1%. This is how people can be wealthier on their balance sheet and still fall behind. As a result, the rich get richer and the poor get poorer.
ARE WE ENTERING AN EASING CYCLE?
Fortunately, the Federal Reserve has recently embarked upon an easing cycle, cutting the overnight rate in September, November and December of 2024. This has helped the average American household. However, debt service costs are still substantially higher than they were at the end of 2021.
That is an additional, roughly 4.25% on most types of variable rate debt, which hurts.
The Fed will have to cut the overnight rate at least another 100 basis points (1.00%) in order for John Everyman to begin to feel any real relief. Of course, when that happens, asset prices should climb, and the rich will get richer still. If it seems like wealth/income inequality is currently “baked” into our system, it sort of is.
That is the reason so many Americans feel as though the economy isn’t as good as the government has been saying. Their higher financing costs are offsetting most of the gains they have been making elsewhere. Finding and having a job helps to mitigate the pain, but doesn’t completely alleviate it.
As for the future of job growth in the U.S. economy? The tea leaves and crystal balls throughout the country suggest it will slow, but not collapse, to kick off 2025. Basically, you can expect more modest payroll growth than what we have experienced over the past several years. That is just the”‘low-hanging fruit” bet after years of outsized gains.
If you have to have a number, a reasonable guesstimate would be a monthly average of around 120-125K net, new payroll jobs over the next 12 months. That is roughly a 35% decline, and would be where I would set the over/under line if I were making a book on it. If I had to bet on that line, I would place $100 on the under and $50 on the over.
In the end, and here at the end of 2024, I didn’t do the same podcast with the same folks as I did last year. However, my forecast would be about the same for the first half of next year, around 1.50% GDP growth. After the surprising strength of the past two years, in particular, one has to truly wonder what the U.S. economy can do for an encore.
With that said, it doesn’t stop on a dime for anyone.
This content is part of our quarterly outlook and overview. For more of our view on this quarter’s economic overview, inflation, bonds, equities and allocations, read the latest issue of Macro & Market Perspectives.
The opinions expressed within this report are those of the Investment Committee as of the date published. They are subject to change without notice, and do not necessarily reflect the views of Oakworth Capital Bank, its directors, shareholders or associates.


