
The performance of the stock market in Q2 is even more impressive given the environment and backdrop at the end of Q1. On February 19, 2025, the S&P 500 made a new all-time high.(1) But momentum quickly faded. The health of the U.S. consumer came into question following a weak earnings report from Walmart, and in March—the final month of the first quarter—the S&P 500 declined 5.7%, falling 10% from its February peak. Additional signs of consumer softness quickly followed, further clouding the outlook.(2)
LIBERATION DAY
The reciprocal tariffs announced on April 2nd sent the stock market into an even deeper spiral.(3) How would a fatigued U.S. consumer handle massive tariff-related price hikes? Many economists soon started calling for a recession —and the market took notice. Just 5 trading days after the Liberation Day announcement, the S&P 500 found itself down over 15% year-to-date.(4)
Relief came on April 10th, when the White House announced a 90-day pause on reciprocal tari s, easing pressure on the markets. From there, the stock market handled what seemed to be a barrage of headlines regarding the o -again, on-again status of multiple trade deals. And as if the tariff uncertainty was not enough to rattle the markets, rising problems in the Middle East — specifically between Israel and Iran — added fuel to the fire. Yet 12 straight days of rockets and bombs did not seem to have any negative effect on equity prices. In my opinion, the climbing of the “wall of worry” was underway.
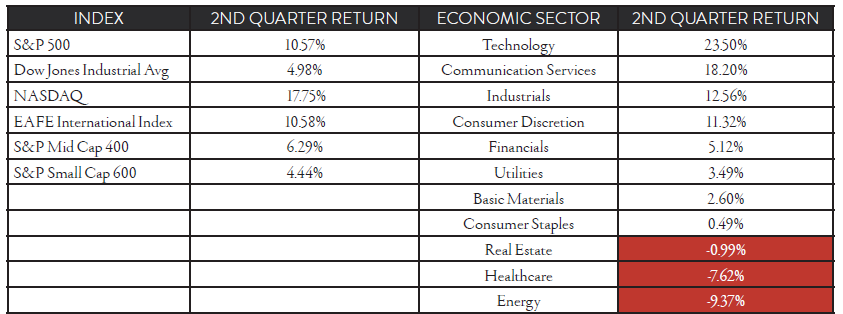
The S&P 500 ended the quarter with a 10.9% gain.(4) The risk-on feeling from investors propelled the tech-heavy NASDAQ to a return of 18%.mid-cap (+6.7%) and small-cap (+4.9%) indices delivered sound returns but underperformed their large-cap peers. (4) Recession fears, sparked by tariff-related price increases seemed to prompt investors to lower their exposure to those smaller stocks that typically underperform
during downturns.
International equities held up relatively well. The EAFE index showed another solid return in the 2nd quarter, returning 10.6%.6 After significant outperformance in the 1st quarter compared to all domestic stock indices,(4) international markets continued to shine in 2nd quarter.
The S&P 500 performance was led by the Technology sector, up 23.5% return.(4) Strong rebounds by NVIDIA, Microsoft and Broadcom led the move in tech. Other stand-out sectors included Communication Services (+18.2%), Industrials (+12.6%) and Consumer Discretion (+11.3%). (4)
The tensions between Israel and Iran helped to briefly push oil prices higher, but by quarter’s end, crude had retreated from its highs.(7) Oil prices spent the majority of the past three months between the upper $50s and lower $60s per barrel, well below Q1 levels.(7) That drop seemed to weigh heavily on energy stocks. After having the strongest return of any economic sector in Q1, Energy finished Q2 at the bottom, posting a -9.4% return.(8)
Healthcare was the other sector that seemed to struggle in Q2. While the weakness was broad — standouts like Eli Lilly and Johnson & Johnson both posted negative returns— it was the performance of UnitedHealth that appeared to put the most downward pressure on the sector .(9,10,11) UNH, one of the largest stocks in the S&P 500, declined by just over 40% during the quarter.(11) That performance made an already weak stretch for Healthcare into a seemingly miserable one, with a loss of 7.6% over the past three months.(12)
*Source: Bloomberg, July 2025
The 1st quarter earnings season — ultimately much stronger than most analysts predicted — was consumed with concerns around the new tariff policy, and how companies and consumers might react. In many cases, a very solid earnings report was coupled with a downward revision to future earnings expectations. The large cloud of uncertainty that set over the economy seemed to give companies cover to bring down full-year earnings expectations.(13)
And they did.
As the 2nd quarter began, analysts expected the S&P 500 to record $270 in earnings for 2025.14 But even after 1st quarter earnings came in at $63.07 — well above the $60 estimate — full-year earnings expectations now sit at $263. At a closing price of 6,204.95, the S&P 500 is now trading at a P/E ratio of 23.6 times this year’s expected earnings.(14) By almost any valuation measure, it appears that the S&P 500 is starting to look expensive.
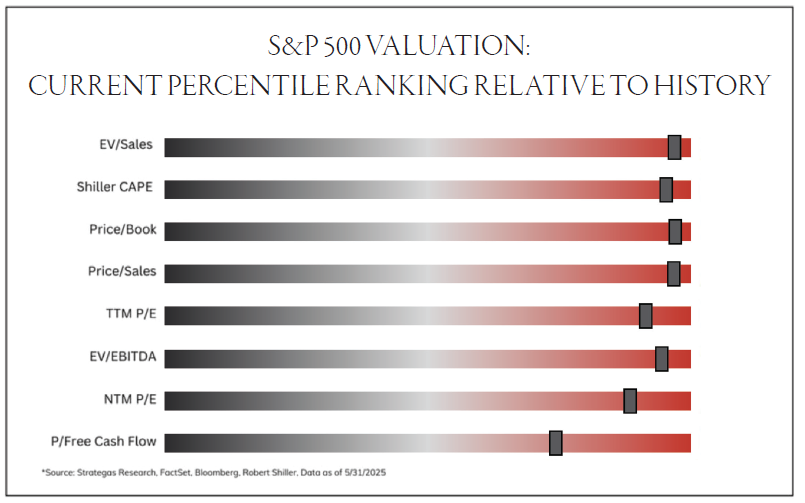
Keep in mind, valuation is not always a great predictor of short-term market moves. As John Maynard Keys famously said: “The market can remain irrational longer than you can remain solvent.” The stock market is a leading economic indicator, meaning it will move higher before you will likely start to see improvement in the actual economy, and before earnings estimates catch up.
It is important, however, to understand current valuations in order to better appreciate potential downside risk. A recession that strikes with a market trading at 18 times earnings will reach very differently from a market trading at 30 times earnings.
With the fear of tariff-related price increases in the pipeline, the 2nd quarter saw surprisingly strong economic activity. The high-end consumer, who now appears to control more and more discretionary income, acted before price increases could be implemented, making large purchases in the 2nd quarter. Auto sales, for example, were as strong as when COVID supply chain issues and low interest rates created a car buying flurry back in 2021.(14)
That strong economic activity appears to have helped support the labor market as well. The tariff “nightmare scenarios” that were all over the news in early April included fears of a spike in unemployment numbers. That, thankfully, did not occur in the 2nd quarter. With an unemployment rate of 4.2% and wages increasing by 4.72% annually, the economy hardly looked miserable.15 We expected to see solid spending by the consumer, and that seemed to be the case over the past three months.
LOOKING FORWARD
Expectations for 2nd quarter S&P 500 earnings have fallen to $62.64 —a relatively low bar for the market to clear.14What may be more interesting is the outlook for the second half of the year. Do companies see the consumer remaining strong in the last 6 months of 2025, or was some of the Q2 strength just sales that were “borrowed” from the 3rd and 4th quarters? Those 2nd quarter earnings announcements may give us some clues.
Another key development in the 3rd quarter is that Liberation Day 90-day delay on reciprocal tariffs is set to expire.5 Will we see new long-term trade deals announced, another extension or an escalation of tariff rates?
The Federal Reserve will be watching closely. With core inflation numbers cooling down the past few months, it is my opinion that the potential inflationary effects of the new tariff policy is the main reason the Fed has not cut interest rates this year. If we get more clarity on the tariff picture moving forward, the Fed could have the ability to lower interest rates in the 3rd quarter.
Finally, can the labor market remain unbelievably resilient? There seem to be small signs of cooling, but that does not necessarily mean we are on the verge of a spike in unemployment rates. I think it is fair to say both the labor market and economy are slowing, but with some potential help from the Fed in the form of anticipated falling interest rates. In other words, things are seemingly good, just not necessarily great.
For investors, the greater concern may be where the earnings growth will come from. The stock market can move higher when either earnings increase or stocks trade at a higher multiple. So far in 2025, the market’s gains have all come from multiple expansion. In my opinion, it would be nice to see earnings’ momentum come in to support the impressive rally we’ve seen over the past 10 weeks. We seem to have climbed the wall of worry, now it is time to see improving fundamentals support that view from the top.
This content is part of our quarterly outlook and overview. For more of our view on this quarter’s economic overview, inflation, bonds, equities and allocations, read the latest issue of Macro & Market Perspectives.

SOURCES
- Reuters February 2025 – S&P 500 Ekes Out All-Time Closing High as Fed Minutes Eyed
- CNBC April 2025 – Dow Nosedives 1,600 Points, S&P 500 and Nasdaq Drop the Most Since 202 after Trump’s Tariff Onslaught
- NPR April 2025 – Markets Plunge After ‘Liberation Day’ Tariffs
- Y-Charts 2025 – S&P 500
- CNBC April 2025 – Global Markets Soar on Trump Tariff Pause
- Y-Charts July 2025 – MSCI EAFE
- CNBC April 2025 – Oil Prices and News
- Y-Charts July 2025 – S&P 500 Energy (Sector)
- Y-Charts. “Eli Lilly (LLY) – Price & Performance.
- Y-Charts. “Johnson & Johnson (JNJ) – Price & Performance.
- Y-Charts. “UnitedHealth Group (UNH) – Price & Performance.
- Y-Charts July 2025 – S&P 500 Health Care (Sector)
- Yardeni Research April 2025 – S&P Earnings & The Economy
- Yardeni Research April 2025 – YRI Earnings Outlook
- Y-Charts. U.S. Total Vehicle Sales
- Y-Charts. U.S. Unemployment Rate
Advisory Services, including investment management and financial planning, are offered through Oakworth Asset Management LLC a registered investment advisor and is owned by Oakworth Capital Bank, Member FDIC. Investment products and services offered via Oakworth Asset Management LLC are independent of the products and services offered by Oakworth Capital Bank, and are not FDIC insured, may lose value, have no bank guarantee, and are not insured by any federal or state government agency. Because of the ownership relationship and involvement by Oakworth Asset Management LLC associates with Oakworth Capital Bank, there exists a conflict of interest to the extent that either party recommends the services of the other. Oakworth Asset Management LLC does not provide tax or legal advice. You should consult your tax advisor, accountant, and/or attorney before making any decisions with tax or legal implications. For additional information about Oakworth Asset Management LLC, including its services and fees, send for the firm’s disclosure brochure using the contact information contained herein or visit advisorinfo.sec.gov.
This communication contains general information that is not suitable for everyone and was prepared for informational purposes only Nothing contained herein should be construed as a solicitation to buy or sell any security or as an offer to provide investment advice. The information contained herein is based upon certain assumptions, theories and principles that do not completely or accurately reflect
any one client situation. This communication contains certain forward-looking statements that indicate future possibilities. Due to known and unknown risks, other uncertainties and factors, actual results may differ. As such, there is no guarantee that any views and opinions expressed herein will come to pass. Investing involves risk of loss including loss of principal. Past investment performance is not a guarantee or predictor of future investment performance.
Any reference to a market index is included for illustrative purposes only as it is not possible to directly invest in an index. The figures for each index reflect the reinvestment of dividends, as applicable, but do not reflect the deduction of any fees or expenses, the incurrence of which would reduce returns. It should not be assumed that your account performance or the volatility of any securities held in your account will correspond directly to any comparative benchmark index. This communication contains information derived from third party sources. Although we believe these sources to be reliable, we make no representations as to their accuracy or completeness.
All opinions and/or views reflect the judgment of the authors as of the publication date and are subject to change without notice.