
For the first few decades of the 21st century, Americans put little thought into inflation. Yet for the past five years, it has dominated headlines. Many consumers have likely felt the impact, but much like a slow leaking tire, it isn’t noticeable until one day it is.
Yet anyone following the headline inflation data might conclude that price pressures are more contained than consumers report. This raises an important question: Is the data flawed? Or is the Bureau of Economic Analysis missing something?
Not necessarily. While economists sometimes question the data’s validity, a more complex issue is emerging in the economy.
The gap between economic reports and consumer sentiment reflects a growing divide in the underlying health of the consumer.
The Divided Consumer and K-shaped K-shaped Economy
For American households, the experience of inflation has not been consistent. The essentials of daily life—housing, insurance and food—have steadily become more expensive, adding downward pressure to the discretionary budgets of the bottom 80% of consumers. By contrast, the top 20% of consumers appear largely unaffected. Some have even seen their spending bolstered by rising asset prices in recent years.
This concept is often described as a “K-shaped” economy—a divergence between higher-earning households at the top and lower-earning households at the bottom.(1)
While the cost of living has continued to rise, many goods and services associated with “living it up” have seen only modest price increases or have remained flat. The result is a deeper structural divide. Essential inflation is straining lower-income households and weighing heavily on sentiment, while higher-income consumers, more insulated from these pressures, have sustained spending and buoyed headline economic data.
What the Data Says
To understand the present, it is important to first examine the past. Since COVID-19, inflation has remained top of mind for most Americans—and for good reason. From January 2020 to January 2026, the Federal Reserve’s preferred inflation measure, Personal Consumption Expenditures (PCE), increased by 21.70%, equating to roughly 3.62% annualized inflation.(2) While this figure is well above the Federal Reserve’s 2% target, it still understates the experience of many consumers, particularly as price increases have been concentrated in essential categories.
Personal Consumption Expenditures: Chain-Type Price Index
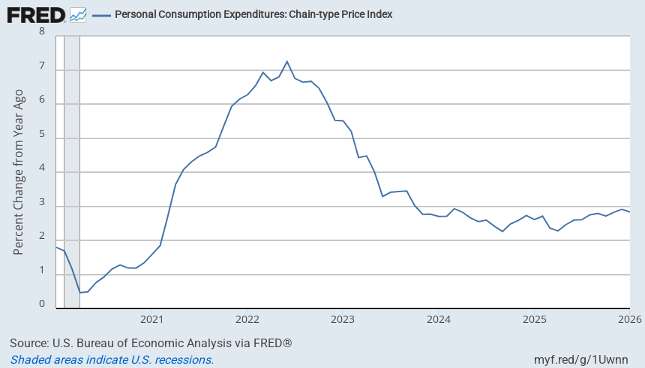
Source: U.S. Bureau of Economic Analysis via FRED®
A closer look at the underlying PCE data reveals meaningful differences across categories. For example, recreational goods and vehicles averaged a monthly price change of -0.05% between January 2020 and January 2026, indicating relatively stable pricing.3 In contrast, necessity categories show a clear divergence. Food and beverages purchased for off- premises consumption rose an average 0.35% per month over the same period, peaking at 2.20% in April 2020.
This divergence is also evident in services, which have outpaced goods inflation overall, Services increased at an average monthly rate of 0.33% compared with 0.19% for goods. Within services, essential categories stand out. Housing and utilities — a fundamental need for all households — rose an average 0.39% per month. Financial services and insurance, which affect the majority of Americans, increased at an even higher monthly rate of 0.43% (3)
Why the Experience Feels Different
If essential goods and services are rising in cost, it is no surprise that many Americans—particularly those in lower-income tiers—feel increasingly pessimistic about the economy. The question, then, is why this divergence exists and how it has developed. There is no single explanation, but several key factors help explain the disparity.
- Technology has long acted as a deflationary force, as seen in the relatively modest price changes of high-cost consumer technology. Advances in production have made once-expensive manufacturing processes more efficient improving product quality while in some cases, reducing prices. Television technology offers a clear example: bulky, complex screens have evolved into thinner, lighter and more cost-effective designs. This can also be applied to other industries that are not so obvious, with the global rise of automation.
- Even entertainment events can lower overhead costs by using technology to assist in ticketing, organization and disseminating information.
Another reason some goods and services have experienced uneven price increases is the distinction between temporary supply chain disruptions and sustained increases in input costs and cost of goods sold.
During and after the pandemic, global supply chains were severely disrupted, leaving suppliers and distributors unable to access necessary goods and services. As the global economy reopened, many of these bottlenecks eased and prices began to normalize. However, some cost pressures have proven more persistent due to structural increases in key inputs. Energy is a prime example, with prices influenced by shifting geopolitical, economic and social conditions. Events such as the war in Ukraine and ongoing tensions involving the United States and Iran have contributed to elevated oil prices, which ripple through the broader U.S. economy.
By comparison, housing faces more structural supply constraints. Higher financing costs and limited turnover—particularly in a market shaped by previously low mortgage rates—have sustained upward pressure on both home prices and rents. Unlike many goods, housing is location-dependent, slow to adjust and heavily influenced by regulation and zoning.
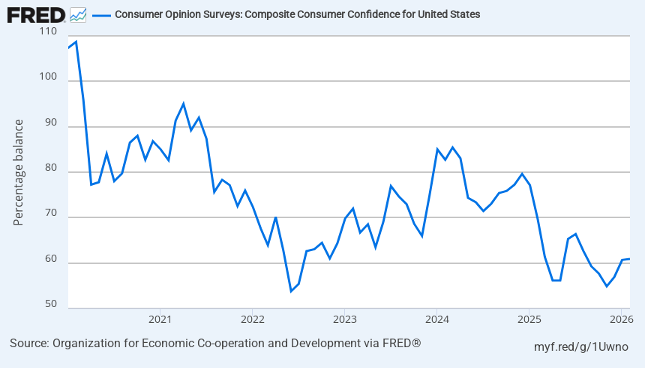
This divergence is reflected in consumer sentiment. Many households, particularly lower-income earners, report growing frustration with economic conditions. Consumer confidence, as measured by the Consumer Opinion Surveys Composite Consumer Confidence Index for the United States (St. Louis Fed), has declined since early 2020. The index peaked at 108.67 in February 2020 before falling steadily as the pandemic unfolded.
The reading never fully recovered even as global supply chains reopened and broader economic conditions improved. The Federal Reserve reported consumer confidence at an all-time low of 53.79 in July 2022. In the years since, it has remained subdued—never exceeding 85 and most recently reading 60.89. Viewed in context, this suggests that while consumers were initially uncertain and anxious during the pandemic, that sentiment has persisted—and in some cases intensified—even as headline conditions have improved.(4)
Consumer Opinion Surveys: Composite Consumer Confidence For United States
Looking Ahead
It is reasonable to anticipate a shift in the consumer environment. Sticky inflation—particularly in essential categories—continues to weigh on household financial health. While wages have increased, the cost of everyday necessities has risen even faster. This presents a complex challenge for policymakers, including the Federal Reserve and elected officials: how can these pressures be effectively addressed?
Limits and Constraints
The Federal Open Market Committee has tools at its disposal to influence economic conditions, including adjusting monetary policy to stimulate growth or reduce liquidity. However, some of these challenges extend beyond its reach. Services inflation, for example, tends to be more persistent and difficult to control. Additionally, structural factors outside the Fed’s jurisdiction—such as zoning regulations that constrain housing supply or healthcare policies that drive up costs—continue to contribute to elevated prices.
There is unlikely to be a simple or immediate resolution. Like many economic challenges facing Americans today, this issue will take time to unfold. Still, there is reason for cautious optimism over the long term. Consumers have consistently demonstrated an ability to adapt, adjusting behaviors and priorities to navigate periods of economic strain—even when doing so involves meaningful trade-offs. For most households, the distinction is clear. Luxuries can be adjusted. Necessities cannot. That is what makes the current environment feel fundamentally different.
SOURCES:
- NPR, “What is a K-Shaped Economy? Dec. 31, 2025.
- U.S. Bureau of Economic Analysis, Personal Consumption Expenditures (PCE), via Federal Reserve Bank of St. Louis (FRED) Accessed 6 Apr. 2026.
- Bureau of Economic Analysis, “Interactive Data Tables.”
- Organization for Economic Co-operation and Development (OECD), via Federal Reserve Bank of St. Louis (FRED).
Advisory Services, including investment management and financial planning, are offered through Oakworth Asset Management LLC a registered investment advisor and is owned by Oakworth Capital Bank, Member FDIC. Investment products and services offered via Oakworth Asset Management LLC are independent of the products and services offered by Oakworth Capital Bank, and are not FDIC insured, may lose value, have no bank guarantee, and are not insured by any federal or state government agency. Because of the ownership relationship and involvement by Oakworth Asset Management LLC associates with Oakworth Capital Bank, there exists a conflict of interest to the extent that either party recommends the services of the other. Oakworth Asset Management LLC does not provide tax or legal advice. You should consult your tax advisor, accountant, and/or attorney before making any decisions with tax or legal implications. For additional information about Oakworth Asset Management LLC, including its services and fees, send for the firm’s disclosure brochure using the contact information contained herein or visit advisorinfo.sec.gov.
This communication contains general information that is not suitable for everyone and was prepared for informational purposes only. Nothing contained herein should be construed as a solicitation to buy or sell any security or as an offer to provide investment advice.
The information contained herein is based upon certain assumptions, theories and principles that do not completely or accurately reflect any one client situation. This communication contains certain forward-looking statements that indicate future possibilities. Due to known and unknown risks, other uncertainties and factors, actual results may differ. As such, there is no guarantee that any views and opinions expressed herein will come to pass. Investing involves risk of loss including loss of principal. Past investment performance is not a guarantee or predictor of future investment performance.
Any reference to a market index is included for illustrative purposes only as it is not possible to directly invest in an index. The figures for each index reflect the reinvestment of dividends, as applicable, but do not reflect the deduction of any fees or expenses, the incurrence of which would reduce returns. It should not be assumed that your account performance or the volatility of any securities held in your account will correspond directly to any comparative benchmark index. This communication contains information derived from third party sources. Although we believe these sources to be reliable, we make no representations as to their accuracy or completeness.
All opinions and/or views reflect the judgment of the authors as of the publication date and are subject to change without notice.