
The Bureau of Economic Analysis (BEA) reported Gross Domestic Product (GDP) in the United States increased by a whopping 4.3% during the third quarter of 2025. The median estimate in the Bloomberg survey was for a 3.3% reading. Let’s just say a lot of folks who submitted a prediction didn’t exactly nail the BEA’s first stab at this number.
But why, or how, did Wall Street miss this the way it did?
The best way of trying to interpret this is to simply break down the number.
According to the BEA, personal consumption expenditures (PCE) grew at a healthy 3.5% annualized rate last quarter. Of particular interest? What we spent on “recreational goods and vehicles” and “health care services.” These added 33 basis points and 76 basis points, respectively, to the overall equation. Also, the somewhat nebulous “other nondurable goods” contributed 30 basis points, and “other services” accounted for 40 basis points.
Everything else? At first blush, to me, the data looks neither encouraging nor discouraging.
Not surprisingly, it seems U.S. businesses continued to draw down on their inventories, as inventory reductions shaved 22 basis points from the economy. Overall, “private fixed investment” was neither fish nor fowl, and “government consumption expenditures and gross investment” added a somewhat normalized 39 basis points.
So, from where did all of this supposed massive economic growth come? I mean, the most recent GDP report reads like an economy growing in, say, the 2.5 to 3.0% range. 4.3%?
How now brown cow?
Well, it seems the continued improvement in our trade deficit, after the first quarter’s blowout, added 1.59% to the aggregate GDP equation. Again, 1.59%. Another way to think about this data is if you were to “factor out” this portion of the report, according to my calculations, the economy grew at an annualized 2.75% rate.
That is much better than having a sharp stick in the eye. Most things are. However, 2.75% doesn’t pack quite the same punch as 4.3%. Does it?
So, what happened?
If the BEA’s calculations are accurate, our exports increased at an 8.8% annual rate during the quarter, and our imports fell 4.7%. That seems like a pretty big swing, and I suppose it is. Now, before you bow up and prance around the room, the GDP report suggests our trade deficit was still in the neighborhood of $950 billion.
Which is a pretty big improvement from the estimated $1.381 trillion trade deficit we ran in the first quarter, over $400 billion. That, ladies and gentlemen, is how you can run a deficit roughly equal to the nominal, annual GDP of Taiwan AND have it be a boost to your economy! You run a massive, and I mean gaudy, trade deficit during the first quarter of any given year. Just stock the shelves and the warehouses at the start of the year and sell off during the remainder might get you to that point.
Sure, the first quarter might look awful. But think about how awesome the rest of the year could look!
Now, a knee-jerk reaction might be: “come on, Norris, an improvement in the trade deficit IS an improvement in the trade deficit. Intuitively, we have to be exporting more stuff.” Am I right?
If you don’t care how you define “stuff,’ then, yeah, we have increased our exports over the last 12 months. In fact, by my calculations using data from the report, over the last 12 months, our overall exports have increased by a somewhat reasonable 3.49%.
That isn’t so bad, is it?
Well, consider the following chart from the Federal Reserve Bank of St. Louis. It shows U.S. exports “nonmonetary gold.” You won’t need a magnifying glass or an advanced degree in reading charts to determine what has been happening.
US Gold Exports Have Been Soaring
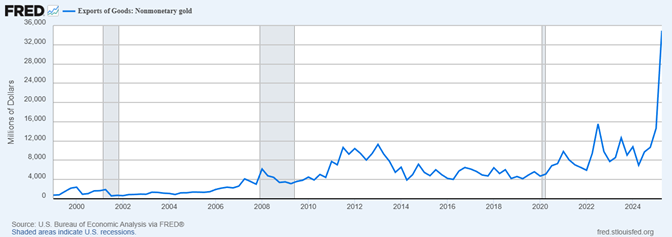
In the second quarter of 2025, the Federal Reserve and the BEA estimate the U.S. exported a whopping $35.93 billion worth of “nonmonetary gold.” What’s more, for the 12 months ending with the second quarter of 2025, it appears the U.S. exported roughly $69.99 billion of shiny stuff. Exports for the 12 months ending in the second quarter of 2024 were $39.49 billion. Obviously, that is an improvement of around $30 billion.
Meanwhile, according to the Census Bureau, it seems overall U.S. exports grew around $72.03 billion over that same time frame. As such, a sharp spike in the global demand for gold appears to have accounted for a little over 40% of the improvement in our trade deficit.
Of course, there are a number of different ways to slice and dice data. Further, you should take all of these numbers and economic reports as ‘best faith’ estimates. The actual “to the penny” truth is undoubtedly a little different.
Even so, the story I have written here is directionally accurate.
U.S. exports have increased, and much of the increase is due to gold. On the flip side, U.S. imports have been significantly less over the last two quarters after ballooning to start the year. The combination of these two sentences has led to some squirrelly-looking GDP reports in 2025 AND a lot of explaining.
In the end, the official number is what the official number is.
The U.S. economy grew at a 4.3% clip in the third quarter of 2025. If that seems too good to be true, well, I am going to bite my tongue on that one.
In the end, the best thing I can say is that the U.S. economy grew by a very reasonable amount last quarter. While it wasn’t maybe as great as the BEA would lead us to believe, it also wasn’t as bad as perhaps many of us feared.
I will take it.
Thank you for your continued support. As always, I hope this newsletter finds you and your family well. May your blessings outweigh your sorrows on this and every day. Also, please be sure to tune into our podcast, Trading Perspectives, which is available on every platform.

John Norris
Chief Economist/Chief Investment Officer, Oakworth Asset Management
Please note, nothing in this newsletter should be considered or otherwise construed as an offer to buy or sell investment services or securities of any type. Any individual action you might take from reading this newsletter is at your own risk. My opinion, as well as those of our Investment Committee, is subject to change without notice. Finally, the opinions expressed herein are not necessarily those of the rest of the associates and/or shareholders of Oakworth Capital Bank or the official position of the company itself.
Opinions and forward-looking statements are subject to change without notice and may not come to pass. Past performance is not indicative of future results.
Advisory Services, including investment management and financial planning, are offered through Oakworth Asset Management LLC a registered investment advisor and is owned by Oakworth Capital Bank, Member FDIC. Investment products and services offered via Oakworth Asset Management LLC are independent of the products and services offered by Oakworth Capital Bank, and are not FDIC insured, may lose value, have no bank guarantee, and are not insured by any federal or state government agency. Because of the ownership relationship and involvement by Oakworth Asset Management LLC associates with Oakworth Capital Bank, there exists a conflict of interest to the extent that either party recommends the services of the other. Oakworth Asset Management LLC does not provide tax or legal advice. You should consult your tax advisor, accountant, and/or attorney before making any decisions with tax or legal implications. For additional information about Oakworth Asset Management LLC, including its services and fees, visit advisorinfo.sec.gov.