
As I sit here on the morning of April 1, it seems like April Fool’s Day is a fitting day to write about the stock market. It is amazing to think about the amount of news that has occurred this past quarter—and the speed at which things are currently changing. Most of the pressing concerns the market is facing today may seem very dated to someone reading this eight or 10 weeks from now.
The military action in Iran that started on February 28 changed the narrative for equity investor, and the daily status updates—and its impact on oil prices—seem to be the primary drivers of stock prices right now.
Before the war in Iran, we were having a very interesting start of the year. To help make sense of this past quarter, let’s look at the last three months in two distinct periods: before and after the start of military action in Iran.
Before Iran (Jan. 1, 2026–Feb. 27, 2026)
We started the year with some optimism that the labor market was stabilizing, inflation was under control and corporate earnings were moving higher. Some investors began to voice concern that the massive amounts of artificial intelligence spending by large growth companies was not producing the returns they’d expected. Even after very strong earnings reports, many of the “Magnificent Seven” stocks did not see gains like in previous quarters.
Investors who wanted exposure to the equity markets—but were concerned about having too much concentration in those massive growth stocks—began rotating into areas of the markets that have been somewhat overlooked over the past three years. Large-value sectors, smaller-cap domestic stocks and international stocks all started the year strong, while the relatively poor performance of the largest growth stocks held back the S&P 500.
Then, in early February, new plug-ins for Anthropic’s Claude AI model sparked fear that they could have a dramatic negative long-term impact on existing software companies. This led to a significant drop in most software stocks in the quarter, including declines in Microsoft (23%), Oracle (24%) and Salesforce (30%).
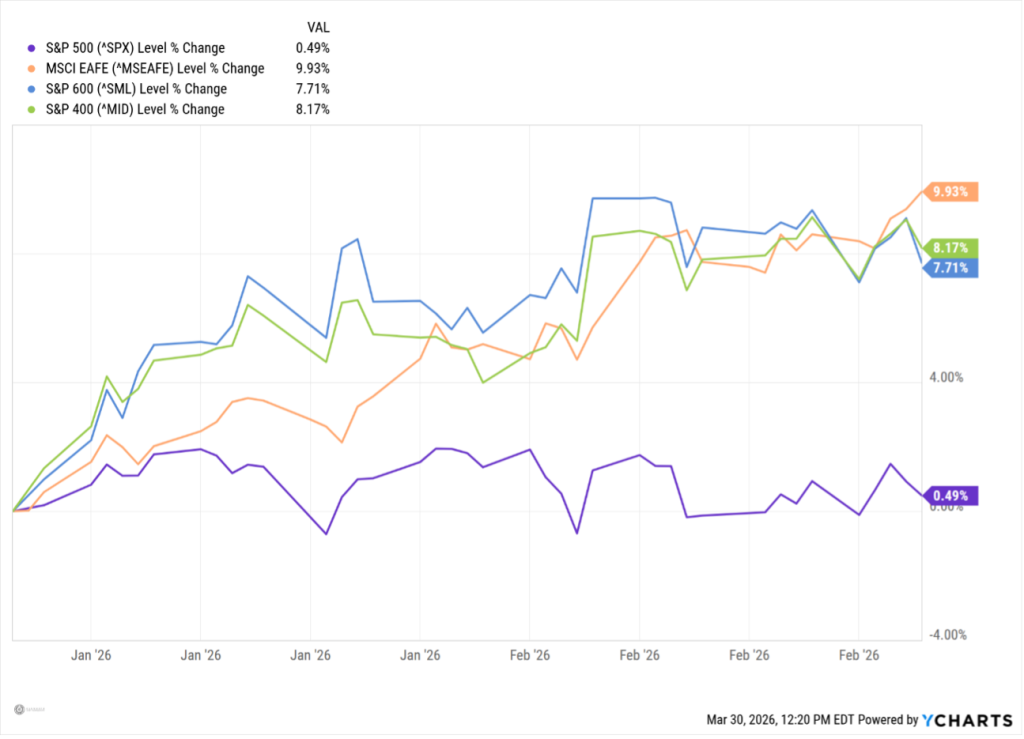
By the close of trading on February 27, mid-cap, small-cap and international indices had all advanced more than 7%, while the S&P 500 was up less than 1%.
Another story that began to unfold in 2026 was stress in the private credit market. Blue Owl, a major private credit lender, faced significant redemption requests from investors. Blue Owl, along with several other providers, was forced to sell assets to cover those redemptions, and some firms have since limited withdrawal requests.
There is growing concern that default rates in private credit could rise as higher interest rates make it more difficult for heavily indebted borrowers to repay loans. This became a drag on financial stocks with private credit exposure, including Apollo (APO, -22.7%) and Blackstone (BX, -24.6%).
By the end of February, most investors believed that the Federal Reserve was on track to cut interest rates one or two more times in 2026. The consumer remained resilient, and confidence was growing that 2026 could be another strong one for equity investors. That confidence started to disappear on February 28.
After Iran (Feb. 29, 2026–March 31, 2026)
Joint military action between the U.S. and Israel against Iran dominated the news as we woke up on Saturday, Feb. 28. The stock market hates uncertainty, and plenty of new uncertanties were suddenly being priced in.
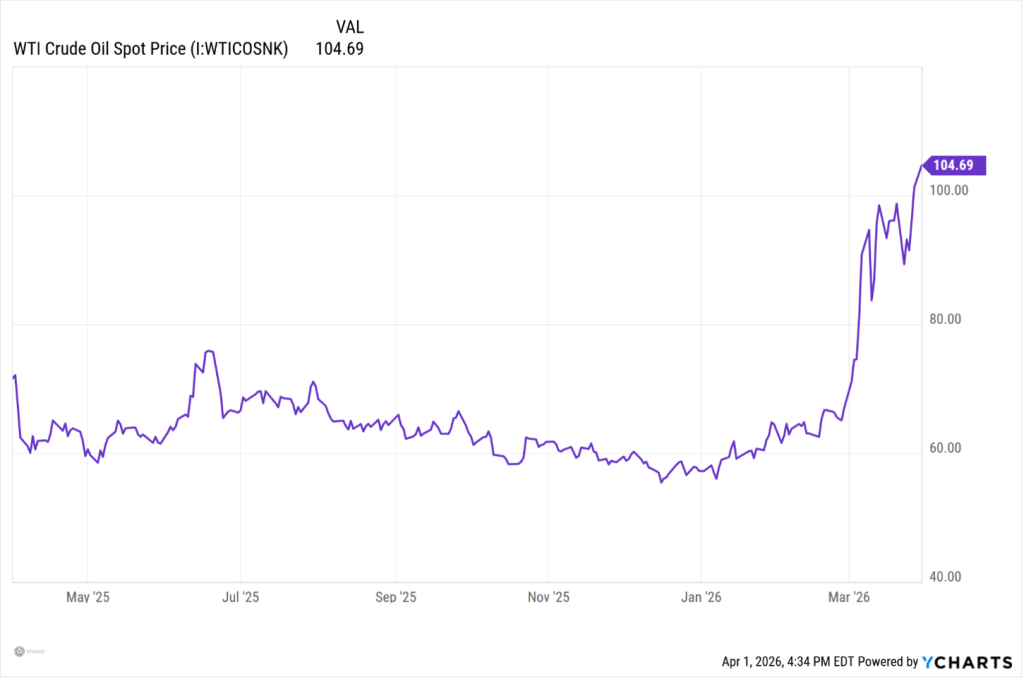
According to the International Energy Agency, around 25% of the world’s oil—roughly 20 million barrels a day—travels through the Strait of Hormuz. The sudden halt of tanker traffic through the strait caused an immediate spike in oil prices. Within a few days, the price of a barrel of West Texas Intermediate crude oil jumped from the mid-$60s to the mid-$90s.
Here are some of the questions equity investors were (and are still) asking:
- How long will military operations continue?
- Can the U.S. secure the Strait of Hormuz and maintain the flow of oil through it?
- How long can oil prices remain elevated before the resilient consumer is affected?
- How will spiking oil prices impact inflation—and how might that influence Federal Reserve interest rate policy?
Oil prices affect the entire economy because oil is a key input for manufacturing, transportation and consumer goods. Think of it as a tax on both businesses and consumers. We started the year with concerns over the health of the consumer and pesky inflation levels. A spike in oil prices is likely to put pressure on both.
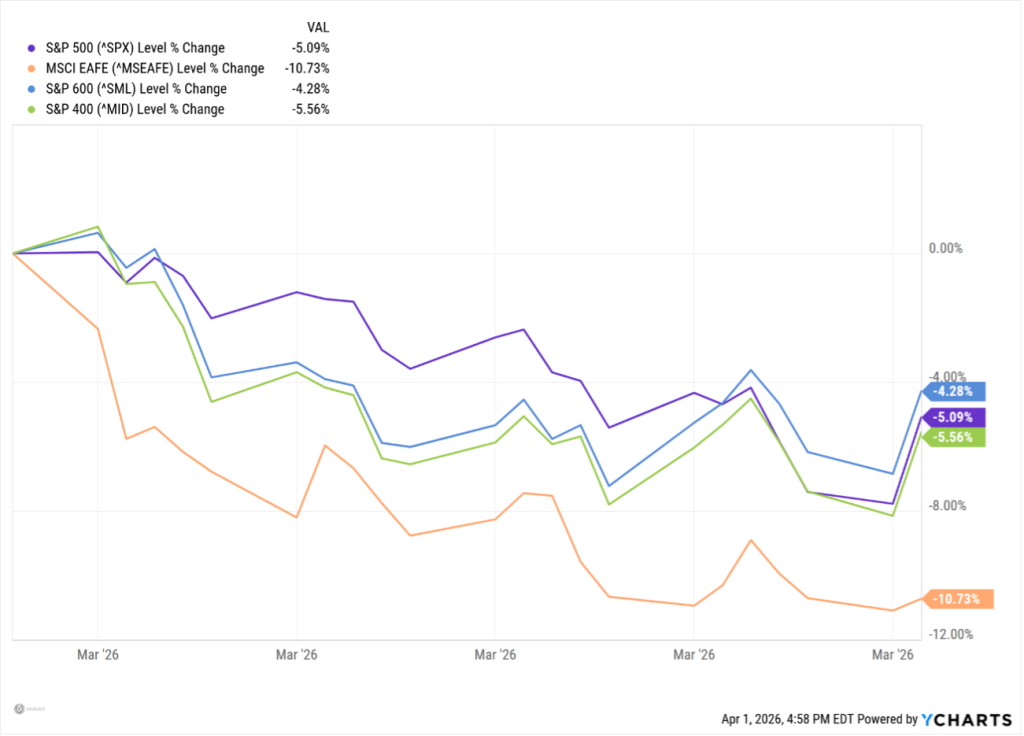
Following the military action in Iran—and the resulting rise in oil prices—all major stocks indices moved lower in unison. The mid and long end of the yield curve shifted higher, pushing mortgage rates up with them. Throughout the month of March, the focus remained squarely on Iran, with investors asking questions that, for now, have no clear answers.
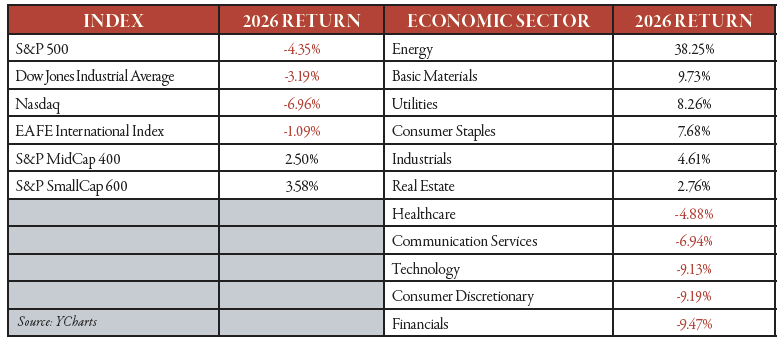
For the full quarter, the S&P 500 declined 4.4%. That performance was helped by a almost 3% rally on the final day of the quarter. Both the small-cap (+3.6%) and mid-cap (+2.5%) indexes posted slightly positive returns, while the EAFE International index fell 1.1%.
Taking an optimistic viewpoint on the past quarter, six of the 11 economic sectors posted positive returns, led by the energy sector’s 38.25% gain. With oil prices spiking at the end of the quarter, it’s no surprise that energy stocks delivered the strongest performance.
Other sectors that managed positive returns over the past three months include basic materials (+9.7%), utilities (+8.3%), consumer staples (+7.7%), industrials (+4.6%) and real estate (+2.8%). The problem for the S&P 500 is that these six sectors carry the smallest weight in the index. In fact, the 224 stocks across those sectors account for only about 24% of theS&P 500’s total weight, less than the combined weight of the four largest stocks in the index (NVDA, AAPL, GOOG and MSFT).
The heavy weighting—and stellar performance—of these large-growth stocks benefited the S&P 500 over the past three years, but became a drag to performance, at least in the first quarter of 2026.
The three sectors that house the Mag 7 stocks, technology (-9.1%), consumer discretion (-9.2%) and communication services (-6.9%) all struggled in the quarter, but the worst performing sector this past quarter was financials (-9.5%).
Financial stocks faced headwinds from several fronts. As mentioned earlier, issues in private credit firms weighed on the firms with exposure to that market. Early in the year, President Donald Trump also floated the idea of capping credit card interest rates at 10%, which pressured companies that rely on credit card revenue. In addition, rising oil prices increased pressure on consumers, and growing concerns about a potential recession raised the risk of defaults across existing loan portfolios. Altogether, this perfect storm of bad news proved to be too much for the financial sector to overcome.
Looking Ahead
As we move into the second quarter, we believe markets will likely react to how the war in Iran winds down and begin to resolve some of the unknowns we faced on April Fool’s Day.
- How long will it take for the Strait of Hormuz to fully reopen?
- What will be the new price range for a barrel of oil?
- Can the consumer remain resilient through ongoing inflationand uncertainty?
- How will companies respond in terms of their workforce?
- Will we start to see an increase in layoffs?
You would think we won’t have to wait too long to start getting answers. Earnings season kicks off in earnest on April 14, when some of the largest banks report results. It’s hard to imagine management will provide overly rosy full-year guidance with so much uncertainty in the air. That doesn’t necessarily mean actual earnings will disappoint, just that companies may set a slightly lower bar for themselves.
It’s also tough to underestimate the resilience of the
American consumer. In mid-March—right in the middle of spiking oil prices and long TSA lines at airports—both Delta and American Airlines raised their earnings guidance at an Airline conference hosted by J.P. Morgan, citing strong bookings. If war in the Middle East, $100+ oil prices and three-hour TSA security lines don’t change travel plans, it’s fair to wonder what will.
One takeaway from market performance in March may be that countries in Asia and Europe are more dependent on oil flowing through the Strait of Hormuz than the U.S. The longer it takes to fully reopen the strait, the more difficult it may be for international stocks to recover from the price decline seen in March.
Another data point that proved highly volatile in the first quarter was expectations for Federal Reserve interest rate policy. In just four weeks, according to CME, investor expectations shifted from an anticipated two 25-basis-point rate cuts in 2026 to the possibility of a 25-basis-point rate hike by year-end. Many believe that this dramatic reversal reflects the impact higher energy prices could have on inflation. If inflation begins to drift higher, it may make it more difficult for the Federal Reserve to support a weakening labor market with lower interest rates.
Over the past several years, as inflation has moved above the Fed’s 2% target rate, the stock market has focused closely on each CPI and PCE inflation report. That focus will likely intensify in the second-quarter, so don’t be surprised to see increased volatility in equity markets on the days those reports are released.
When I sit down to write the second quarter stock market review on July 1, I certainly hope that I won’t need to revisit ongoing military operations in Iran. If current speculation proves correct and the conflict winds down in coming weeks, the focus will shift to restoring normal traffic flow through the Strait of Hormuz.
Advisory Services, including investment management and financial planning, are offered through Oakworth Asset Management LLC a registered investment advisor and is owned by Oakworth Capital Bank, Member FDIC. Investment products and services offered via Oakworth Asset Management LLC are independent of the products and services offered by Oakworth Capital Bank, and are not FDIC insured, may lose value, have no bank guarantee, and are not insured by any federal or state government agency. Because of the ownership relationship and involvement by Oakworth Asset Management LLC associates with Oakworth Capital Bank, there exists a conflict of interest to the extent that either party recommends the services of the other. Oakworth Asset Management LLC does not provide tax or legal advice. You should consult your tax advisor, accountant, and/or attorney before making any decisions with tax or legal implications. For additional information about Oakworth Asset Management LLC, including its services and fees, send for the firm’s disclosure brochure using the contact information contained herein or visit advisorinfo.sec.gov.
This communication contains general information that is not suitable for everyone and was prepared for informational purposes only. Nothing contained herein should be construed as a solicitation to buy or sell any security or as an offer to provide investment advice.
The information contained herein is based upon certain assumptions, theories and principles that do not completely or accurately reflect any one client situation. This communication contains certain forward-looking statements that indicate future possibilities. Due to known and unknown risks, other uncertainties and factors, actual results may differ. As such, there is no guarantee that any views and opinions expressed herein will come to pass. Investing involves risk of loss including loss of principal. Past investment performance is not a guarantee or predictor of future investment performance.
Any reference to a market index is included for illustrative purposes only as it is not possible to directly invest in an index. The figures for each index reflect the reinvestment of dividends, as applicable, but do not reflect the deduction of any fees or expenses, the incurrence of which would reduce returns. It should not be assumed that your account performance or the volatility of any securities held in your account will correspond directly to any comparative benchmark index. This communication contains information derived from third party sources. Although we believe these sources to be reliable, we make no representations as to their accuracy or completeness.
All opinions and/or views reflect the judgment of the authors as of the publication date and are subject to change without notice.