Although it has been well over a decade ago, the bursting of the US housing bubble from 2007-2009 still looms large in the minds of many homeowners, and for good reason. From the end of 2006 through the end of 2009, the S&P 500 CoreLogic Case-Shiller US National Home Price Index fell from a reading of 183.23 to 146.66 over that time frame. This is was a 20% erosion in home prices across the board, with many areas faring much worse than that, much.
Perhaps this is the reason why so many view the sharp spike in housing values during the pandemic with a jaundiced eye. The increase really has been spectacular, as that same home price index has risen a whopping 30% since the end of 2019 through the end of November 2021. Here we go again, huh? As Yogi Berra might say: “it seems like déjà vu all over again.”
In some ways, perhaps. In others, perhaps not so much. I think the difference between “now & then” is similar to the difference between “amazing & stupid.”
Make no bones about it: the increase in home prices has been remarkable. However, there has been an underlying reason for it: strong end consumer demand, for both vacation homes and primary residences. This shouldn’t be surprising. After all, when many forms of vacationing vanished in 2020, people with the means looked for travel alternatives. As a result, beach properties, mountain cabins, and lake homes all skyrocketed in value.
As for primary residences, the economic lockdowns of that year brought new home construction virtually to a halt. Further, many homeowners took matters into their own hands, as it were, and did all sorts of improvements in order to better enjoy their living space; especially since they were likely to spend more time there. However, that doesn’t mean home demand waned, far from it. The inverse is actually true, as available supply collapsed.
Contrast this from the events of 2007-2009.
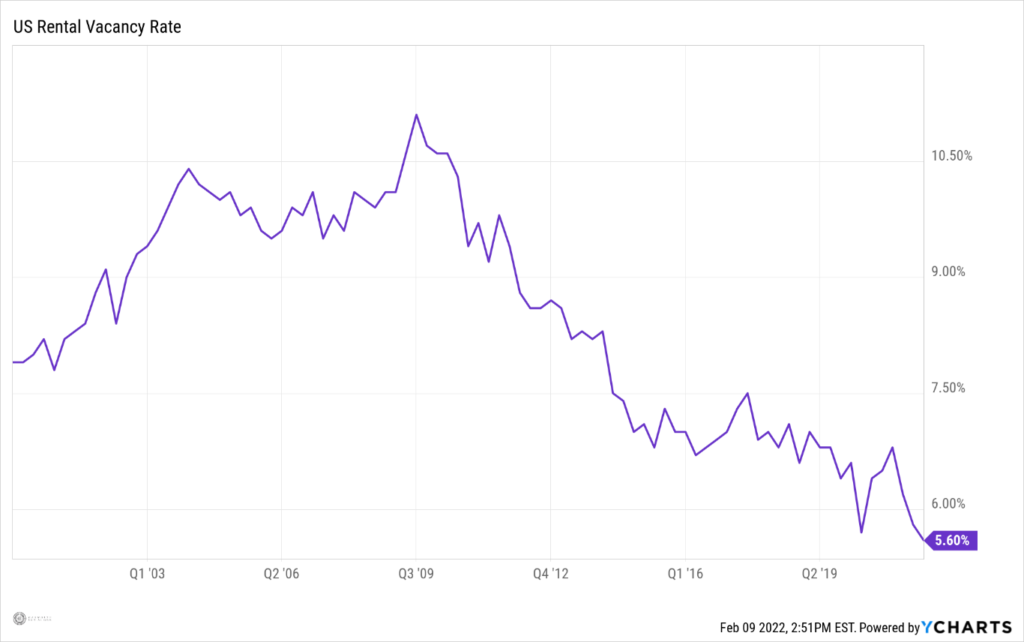
As we all well know, the US housing market was on a tear in the years leading up the crash. However, we also know hindsight is 20/20. After all, ‘vacant housing units for sale only’ had been increasing in 2005 and 2006, but homeowners kept building. So much so, at the end of the 1st Quarter 2008, just before the levee broke, the US Census Bureau estimated there were 2.286 million empty houses on the market for sale, easily an all-time high. What’s more, there were an additional 4.079 million vacant units available for rent at the same time. Up to that date, this was also an all-time high. Therefore, at the end of the 1st Quarter of 2008, there were a total of 6.365 million, in aggregate, vacant housing units in the United States looking for an occupant.
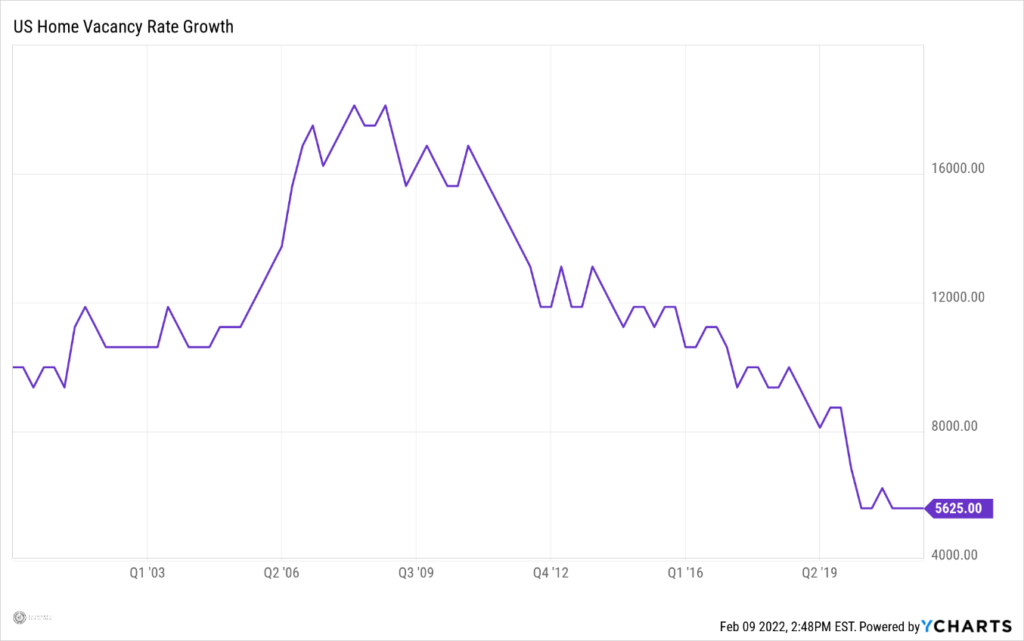
By comparison, at the end of 2021, there were 726K ‘vacant housing units for sale only’ and another 2.644 million available for rent. Combined, that totals 3.370 million homes looking for people to call them home. That is about 53% of the total from 3/31/2006. Not surprisingly, vacancy rates are substantially lower now than they were just prior to the crisis, well less than half for both homeowner and rental units.
As such, you could make a coherent argument the housing market is still reasonably tight despite the recent run-up in prices. What’s more, due to the vast disparities in housing availability and vacancy rates, you could sensibly argue end-consumer demand is driving today’s residential real estate market, whereas speculation played a more major role back in 2006.
The banking data bears out this contention. A caveat, if you will: if the last several paragraphs have been ‘in the weeds’ for you, the next several will be as well.
According to the H.8 report which the Federal Reserve issues every business Friday, domestically chartered banks in the United States had a total of $1.88 trillion in residential real estate loans and leases on their balance sheets in December 2006. This represented fully 34.0% of all loans and leases, and an elevated 25.5% of ALL bank assets. Further, banks had a total of $5.535 trillion in loans and leases, relative to $5.570 trillion with which to finance them. That works out to be in excess of 99%.
Basically, as the bubble was getting ready to pop, the US banking system was lending out everything it had, and much of it was going towards residential real estate. In so many ways, there wasn’t any room for error. Consider the data table below, data from the Federal Reserve:
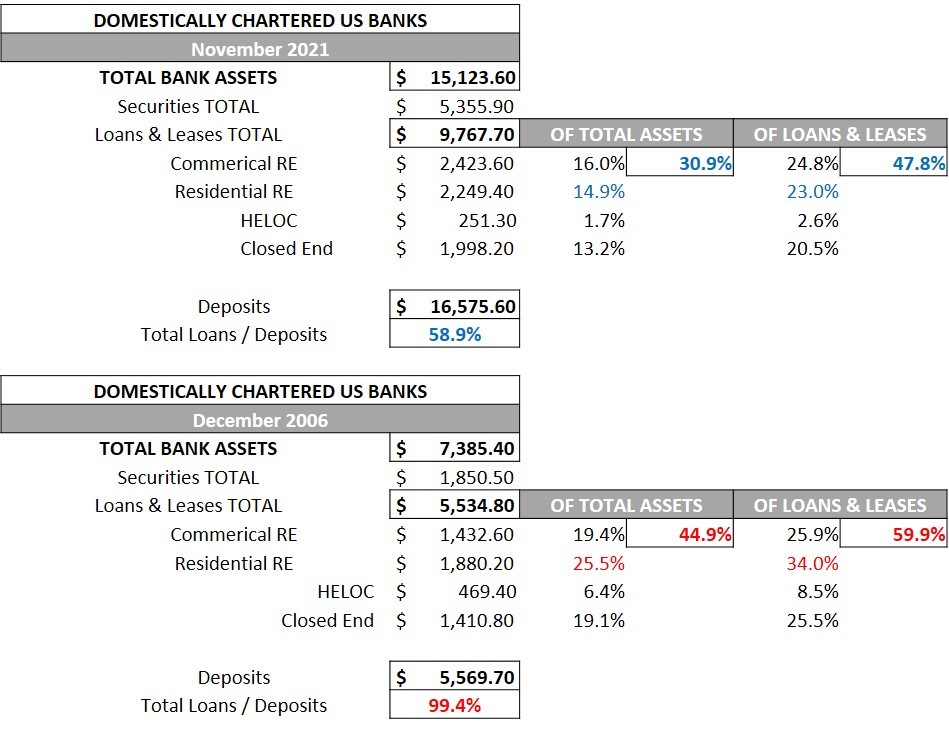
By comparison, there were $2.249 trillion in residential loans and leases on the balance sheets of domestically chartered banks in November 2021. While obviously more in absolute terms, this amount was only 23.0% of all loans and slightly less than 15% of ALL assets. As such, the US banking system is much less exposed to the housing market than it was during bubble, much. Also, last November, banks had a total of $9.768 trillion in loans and leases, relative to $16.56 trillion with which to finance them. That works out to be slightly less than 59%.
In no uncertain terms, the US financial system is far more liquid than it was prior to the financial crisis of 2007-2009, and is much less reliant on real estate in general.
As a result, any upcoming decrease in US home prices will have much more to do with higher interest rates making housing more expensive for the average buyer. As this causes demand to wane, this will cause new housing starts to decline in a far more orderly fashion than they did during the bubble roughly 14 years ago.
That is IF they decline at all.
According to the FHFA US House Price Index, home prices had never fallen during any one calendar year since its inception in 1975 prior to 2007. So, what happened from 2007-2009 was far from normal. However, so was US monetary policy at that time.
For some reason, which is still head-scratching to at least one person, the Federal Reserve kept the overnight target lending rate HIGHER than the yield to maturity on the 10-Year US Treasury from June 2006 through the end of December 2007, as defined by month ends. As such, the Fed intentionally kept the ‘yield curve’ inverted for roughly a year and a half. Remember, inverted yield curves are generally anathema to economic growth, as they tend to curtail lending.
While it remains to be seen what this iteration of the Fed will do during the anticipated, upcoming tightening cycle, it is difficult to imagine it will be as tight for as long as the late Greenspan and early Bernanke Feds were. Frankly, it is unfathomable.
With that said, it is understandable why the recent sharp increases in housing prices have some people nervous. However, there is much that is different this time when compared to the real estate collapse during 2007-2009. First, there currently isn’t the supply there was back then. Second, end consumer demand seems to be much greater now than it was leading up to the bubble, which was rife with speculation. Finally, the US financial system is in much better health than it was and much less reliant on residential real estate.
In conclusion, while no one can look into the future with complete crystal clarity, any future declines in US housing values will likely be due to more normal market forces than a financial system collapse.