As Maximus so notably proclaimed in the cult classic flick Gladiator, “Are you not entertained? Is this not why you are here?” Between old-fashioned bank runs and poor balance sheet management, bonds have certainly given us a dose of “entertainment” in 2023, receiving much of the limelight in the first quarter. The year 2022 will likely remain forever ingrained in investors’ minds, as stock and bond investors alike struggled to find any kind of total return.
And 2023, fresh out of the gate, began with quite the bang.
In January alone, the S&P 500 soared over 6.25%; the Nasdaq jumped a whopping 10.72%; and the Dow rose 4.25%. All the while, the Bloomberg Global Aggregate Bond Index rose over 3.25% — a far cry from its -16.25% collapse in 2022. Despite giving some back in February, the Global Agg still produced a total return of 2.96% at the close of trading on March 31, marking the end of the first quarter.
The bond market during this time saw extreme volatility not equaled since the waning days of the Great Financial Crisis, dating back to December 2009. The benchmark 10-year Treasury note began the quarter yielding 3.79%. The Treasury’s yield peaked on March 2 at 4.08% – a near eightfold increase from the 10-year yield’s historic low of 0.52% on August 4, 2020 – representing an upward move that typically is not observed under “normal” market and economic conditions. Combine that, the lingering effects of interest rate risk leading to principal investment erosion, with the most aggressive Federal Reserve/Central Bank-tightening cycle since that of Paul Volcker almost three decades ago (and shrinking M2, the overall money supply, by the largest amount since that of the Great Depression), and voila: fissures in overleveraged financial institutions and potential liquidity crunches begin to unfold.
Volatility within the bond market was not lacking in the first quarter, as highlighted earlier by the 10-year Treasury. The BofA (Bank of America) ICE (Intercontinental Exchange) MOVE (Merrill Lynch Option Volatility Estimate) Index measures bond market volatility, similar to that of the VIX Index for the broad stock market. The bond market bucket’s sheer size (much larger relative to that of stocks) allows for the index to typically signal what may lie ahead for the equity market.
BofA ICE MOVE INDEX VS. VIX VOLATILITY INDEX
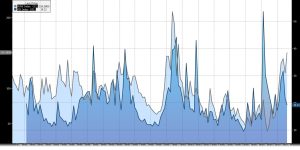
When the MOVE Index rises more than the VIX index, it should signal to investors there may be a serious problem (or perhaps just fear) looming in the market, because bonds should not more with more velocity than stocks.
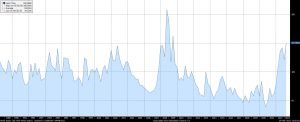
Looking back to “the COVID year,” the MOVE Index briefly hit just under 140 in March 2020, which represented over four standard deviations from its post-2012 average. When the stock (and bond) markets bottomed at the lows of 2022 on October 21, the Index hit 157. On March 15 of this year, at the peak of both rejuvenated financial crisis and monetary policy mistake concerns, the MOVE Index crossed 200 before closing a bit lower at 198.71. This was the second sharpest rise in the index’s history, dating back to its inception year of 1988, with the only higher day on record being September 30, 2008.
BofA ICE MOVE INDEX SINCE INCEPTION
Due to the worries and concerns that may lie ahead for investors, the bond market saw rates rise in the first quarter, largely across the curve, with investors opting for money markets, certificates of deposit and general checking accounts. Despite this still, the yield curve itself did not move in tandem. It did not steepen, at least with any meaningful significance, and it remains all bent out of shape. The 10-2 Year Treasury Yield Spread, representing the delta, or difference, between
the 10-year Treasury’s yield and the 2-year Treasury’s yield, began the quarter and year at -0.61%. It bottomed on March 8 at -1.07%, and it peaked less than three weeks later on March 24 at -0.38%. Obviously, inflation remains elevated in both the marketplace and in the economy.
February’s Consumer Price Index, or CPI, came in at a whopping 6.04% year over year, a far cry from the Fed’s goal of 2.00%, though inflation has begun to increase at a decreasing rate – which investors have taken as a welcome sign.
Core PCE, the Fed’s preferred inflation gauge, came in at 4.60% year-over-year for February, signaling a hotter-than desired inflationary environment that remains omnipresent. The PCE Price Index for Goods remains trailing that of Services; however, we have seen a tick down in the cost of goods relative to recent months.
So what does this have to do with bonds? Quite a lot, actually.
- Higher inflation erodes the purchasing power of future interest and principal payments.
- As a result, inflation expectations can lead to changes in bond yields, with investors requiring higher yields in order to compensate for the expected erosion of future cash flows, thanks to inflation.
- Combine that with a period of financial instability or uncertainty, and bonds could perform poorly – and/or experience volatility.
- As interest rates rise, the expected return for investors on newly issued bonds increases, leading to a general decrease in demand for existing lower yielding bonds.
This jump upward in required or expected yield in order to compensate for the higher rate environment can lead to a decrease in the market value of existing bonds, causing bond prices to fall – along with institutions like Silicon Valley Bank.
In addition, financial instability can exacerbate the effects of a rising rate environment on bond prices by increasing the inherent, or perceived, risk of holding bonds, period. Specifically, those with lower credit ratings – whether that may be agency, corporate, or municipal – may be more “at risk.” As with anything, when investors are uncertain about the financial stability of the issuer (or the overarching banking system in general) they may very well demand a higher risk premium to compensate for the increased risk. In turn, this can lead to further decrease(s) in demand for the bonds in question, leading to a subsequent decrease in their prices – à la Credit Suisse bonds.
A quick recap from Finance 101 for a moment: Bonds with longer maturities and lower credit ratings tend to be more sensitive to changes in both interest rates and market conditions – longer exposure to “unknowns.” Conversely, bonds with shorter maturities and higher credit ratings tend to be less sensitive to rate changes and volatility as their risk profile is lower and are able to provide more stable cash flows.
Looking back on the quarter, however, the different sectors within the broad fixed-income asset class performed quite differently; a welcomed change for bond investors relative to that of 2022, as every sector finished in the black – in both price and total return. See chart below.
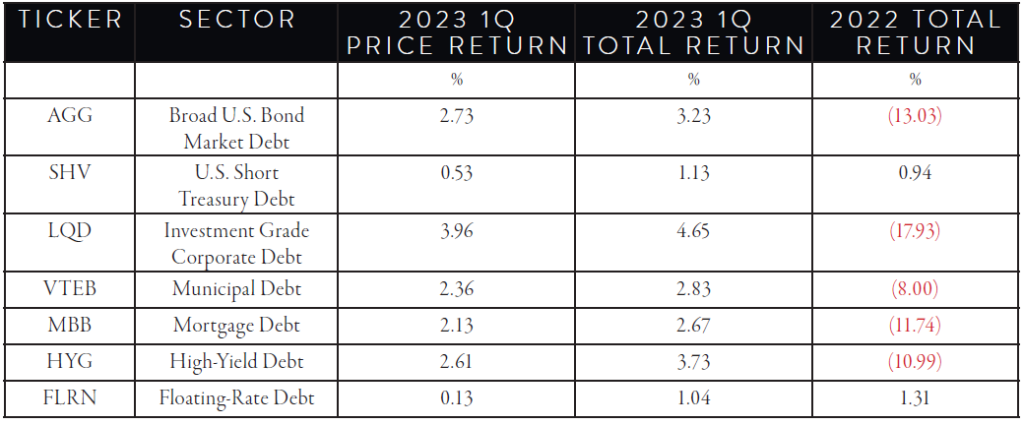
Municipal bond holders fared quite well. Despite lagging a few higher-credit sectors, the municipal sector saw a near
2.50% gain for the quarter amid financial uncertainty and slower economic growth (and perhaps even contraction). The municipal bond sector, specifically, carries inherent credit risk – meaning there is risk that the issuer (state and/or local governments) may default on its obligations. The economy, tax revenues and current political environment can all have lasting effects on this. In addition, government(s) prefer to keep social aid programs going, like child welfare and EBT, relative to keeping debt on the books for, say, an annexed subdivision buildout.
Over all, bonds saw a bump up in the first quarter of 2023 – despite the continued “bad” news cycle. That said, based on March volatility and continued sticky inflation, there may be storm clouds on the horizon.
For more from our Investment Committee in our 1st Quarter 2023 Macro & Market Perspectives, click the image below.